
Study the given bar-graph and answer the question that follows.
The bar-graph shows the production of refrigerators (in thousand) by five different companies A, B, C, D and E during 2004 to 2007.
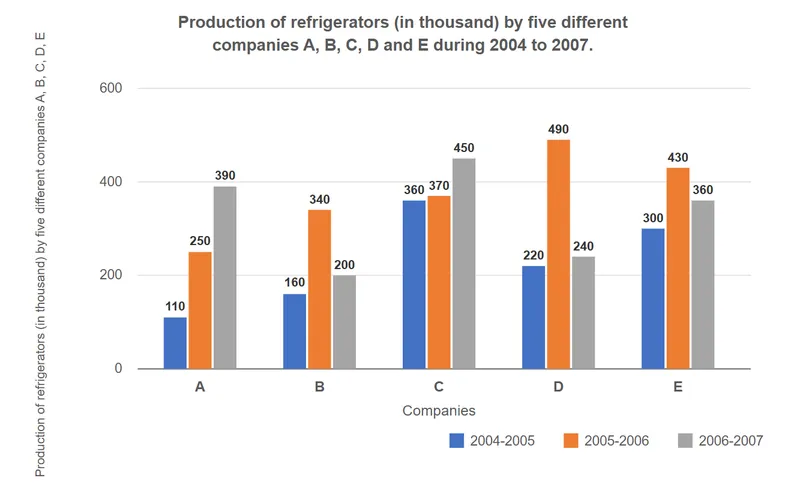
What is the ratio of the average production of the refrigerators by companies A, B and E taken together for the year 2004-2005 to the average production of the refrigerators by companies C and D taken together for the year 2005-2006?
Correct Answer :
19:43
Solution :
Correct Answer: 19:43
From the given bar graph, let us extract the required production values of refrigerators (in thousands):
1. Production of refrigerators by companies A, B, and E for the year 2004-2005 (represented by the blue bars):
Production by Company A (2004-2005) = 110
Production by Company B (2004-2005) = 160
Production by Company E (2004-2005) = 300
Total production by companies A, B, and E in 2004-2005:
Average production by companies A, B, and E in 2004-2005:
2. Production of refrigerators by companies C and D for the year 2005-2006 (represented by the orange bars):
Production by Company C (2005-2006) = 370
Production by Company D (2005-2006) = 490
Total production by companies C and D in 2005-2006:
Average production by companies C and D in 2005-2006:
3. Finding the required ratio:
The ratio of the average production of companies A, B, and E (2004-2005) to the average production of companies C and D (2005-2006) is:
Thus, the required ratio is 19:43.
Access expert-curated educational resources and study materials—completely free.
Create, conduct, and manage professional online assessments with Mindyard. Perfect for teachers and institutes.
Copyright © 2026 Mindyard. All Rights Reserved.




