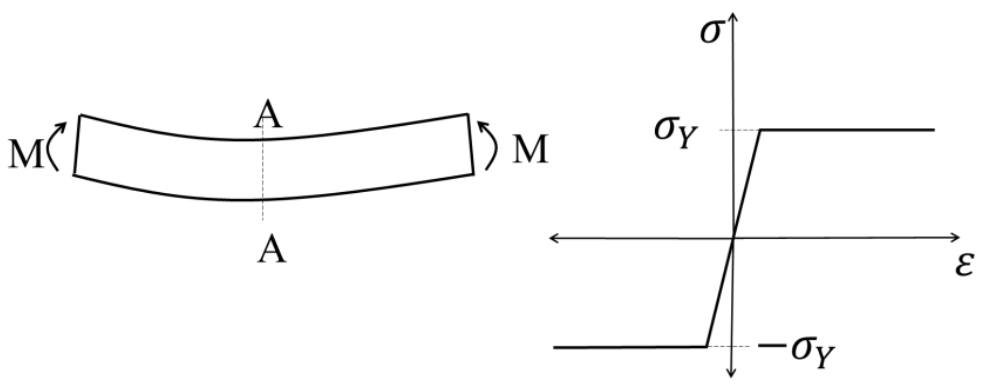
A beam is undergoing pure bending as shown in the figure. The stress (𝜎)-strain (𝜀) curve for the material is also given. The yield stress of the material is 𝜎𝑌. Which of the option(s) given represent(s) the bending stress distribution at cross-section AA after plastic yielding?
Options
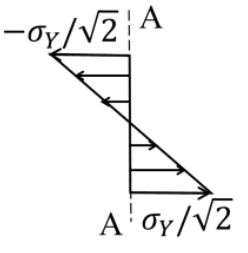
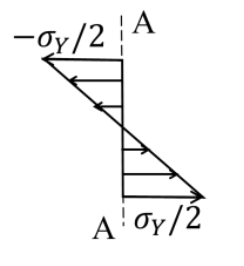
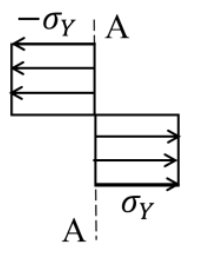
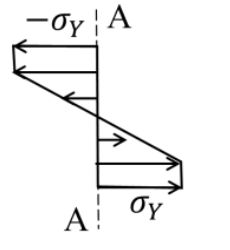
Correct Answer :
Solution :
The correct options representing the bending stress distribution after plastic yielding are the elastoplastic stress distribution (shown in image_4.png) and the fully plastic stress distribution (shown in image_3.png).
Step-by-Step Explanation:
1. Understanding the Beam Bending and Material Behavior
As shown in the first diagram (image_0.png), the beam is subjected to a pure bending moment causing sagging. This means that:
- The fibers above the neutral axis are in compression (negative stress).
- The fibers below the neutral axis are in tension (positive stress).
The stress-strain () curve is elastic-perfectly plastic, meaning:
- For strain magnitude below the yield strain, the stress is linear: .
- Once the yield stress (or in compression) is reached, the stress remains constant at (or ) even as strain continues to increase.
2. Progression of Stress Distribution after Yielding
Under pure bending, the strain distribution across the cross-section AA remains linear because plane sections remain plane:
where is the curvature and is the distance from the neutral axis.
Case A: Partially Yielded (Elastoplastic) State (image_4.png)
As the bending moment increases beyond the elastic limit, the outermost fibers yield first since they experience the maximum strain.
- For the outer fibers where strain exceeds yield strain, stress is capped at the yield stress:
(at the top fibers)
(at the bottom fibers)
- For the inner core closer to the neutral axis, the strain is still below the yield strain. Therefore, the material in this region behaves elastically, resulting in a linear stress distribution.
This combined state corresponds directly to the stress profile shown in image_4.png, where a linear elastic core is bordered by flat plastic regions of stress at the top and at the bottom.
Case B: Fully Plastic State (image_3.png)
If the bending moment is further increased to the fully plastic limit moment, the elastic core shrinks to a negligible width, and almost the entire cross-section yields.
- The upper half of the cross-section is entirely under a constant compressive yield stress of .
- The lower half of the cross-section is entirely under a constant tensile yield stress of .
This corresponds to the step-function stress distribution shown in image_3.png.
Access expert-curated educational resources and study materials—completely free.
Create, conduct, and manage professional online assessments with Mindyard. Perfect for teachers and institutes.
Copyright © 2026 Mindyard. All Rights Reserved.