Options
Correct Answer :
Solution :
Correct Answer:
Step-by-Step Explanation:
1. Understanding the Setup from the Diagram:
From the given figure, an equilateral triangular region of height L contains a uniform magnetic field directed out of the page (in the +z direction).
A conducting loop PQR, also in the form of an equilateral triangle of height L, moves with constant velocity along the +x direction (downward in the diagram).
At t = 0, the leading vertex P enters the magnetic field region at x = 0.
2. Stage 1: Entry into the Magnetic Field Region ():
Let x be the position of vertex P relative to the apex of the field region.
As the loop enters the magnetic field, the area of the overlapping region increases.
For an equilateral triangle of height L, the width w at a distance x from the vertex is proportional to x:
The magnetic flux through the loop is proportional to the area enclosed inside the magnetic field region:
The magnitude of induced electromotive force (EMF) E is:
Since flux out of the page is increasing, Lenz's law dictates that the induced current generates flux into the page (clockwise), corresponding to a negative induced EMF sign convention.
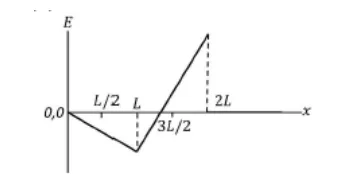
Thus, for , E decreases linearly from 0 to a minimum negative value at x = L.
3. Stage 2: Exit from the Field Region ():
As the loop moves further from x = L to x = 2L, it starts exiting the region of the magnetic field.
The overlapping area is the area of the loop minus the area that has moved out of the field region.
As a result, the flux inside the field region decreases linearly/quadratically with time, causing to change sign and become positive.
Specifically, at the midpoint x = 3L/2, the rate of flux change passes through 0, and by x = 2L, the EMF reaches its maximum positive value before dropping back to zero as the loop completely exits the field region.
4. Conclusion:
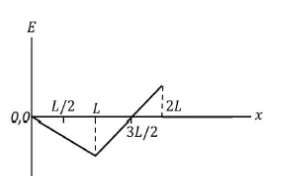
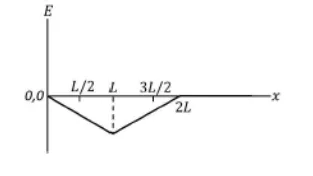
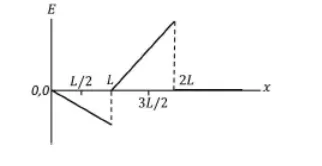
The plot of E vs x is a continuous piecewise linear curve that starts at (0,0), goes linearly negative down to a minimum at x = L, crosses E = 0 at x = 3L/2, and reaches a maximum positive value at x = 2L.
This matches the graph shown in the first option.
Access expert-curated educational resources and study materials—completely free.
Create, conduct, and manage professional online assessments with Mindyard. Perfect for teachers and institutes.
Copyright © 2026 Mindyard. All Rights Reserved.