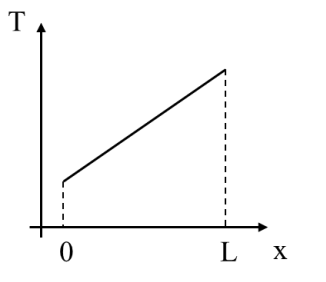
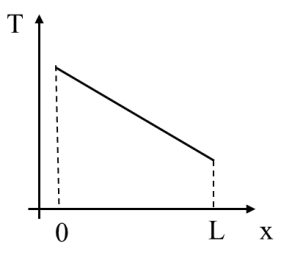
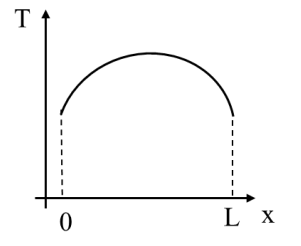
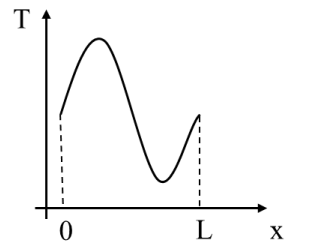
Consider a laterally insulated rod of length L and constant thermal conductivity. Assuming one-dimensional heat conduction in the rod, which of the following steady-state temperature profile(s) can occur without internal heat generation?
Options
Correct Answer :
Solution :
The correct temperature profiles are the linear profiles shown in the first and second images (straight lines with positive and negative slopes, respectively).
1. Governing Physical Principles
For one-dimensional, steady-state heat conduction along the length (-direction) of a laterally insulated rod of length and constant thermal conductivity , the heat conduction equation is:
where:
• is the temperature as a function of position .
• is the constant thermal conductivity of the rod material.
• is the rate of internal heat generation per unit volume.
2. Applying the Constraints
The problem states that there is no internal heat generation, meaning:
Substituting this value back into the heat conduction equation, we obtain:
3. Mathematical Derivation of the Temperature Profile
To find the temperature distribution , we integrate the simplified governing equation twice with respect to :
Integrating once gives:
where is the first integration constant representing the constant temperature gradient.
Integrating a second time gives the temperature profile equation:
where is the second constant of integration.
4. Analysis of the Profiles Shown in the Images
The equation is mathematically a straight line. Therefore, any steady-state temperature profile in a rod without internal heat generation must be linear:
• Image 0 (Increasing Linear Profile): Shows a linear temperature profile starting at a lower temperature at and rising to a higher temperature at (positive slope ). This occurs when the right boundary is maintained at a higher temperature than the left boundary.
• Image 1 (Decreasing Linear Profile): Shows a linear temperature profile starting at a higher temperature at and dropping to a lower temperature at (negative slope ). This occurs when heat flows from left to right due to a higher temperature at the left boundary.
• Image 2 (Parabolic Profile) & Image 3 (Oscillatory Profile): These non-linear curves require either internal heat sources/sinks or transient (unsteady) conditions to occur, as they have non-zero second derivatives ().
Thus, the linear profiles (such as those depicted in the first two options) are the only steady-state profiles that can exist under the given conditions.
Access expert-curated educational resources and study materials—completely free.
Create, conduct, and manage professional online assessments with Mindyard. Perfect for teachers and institutes.
Copyright © 2026 Mindyard. All Rights Reserved.