
Directions (64-66): Read the following bar graph and the table carefully and answer the given question:
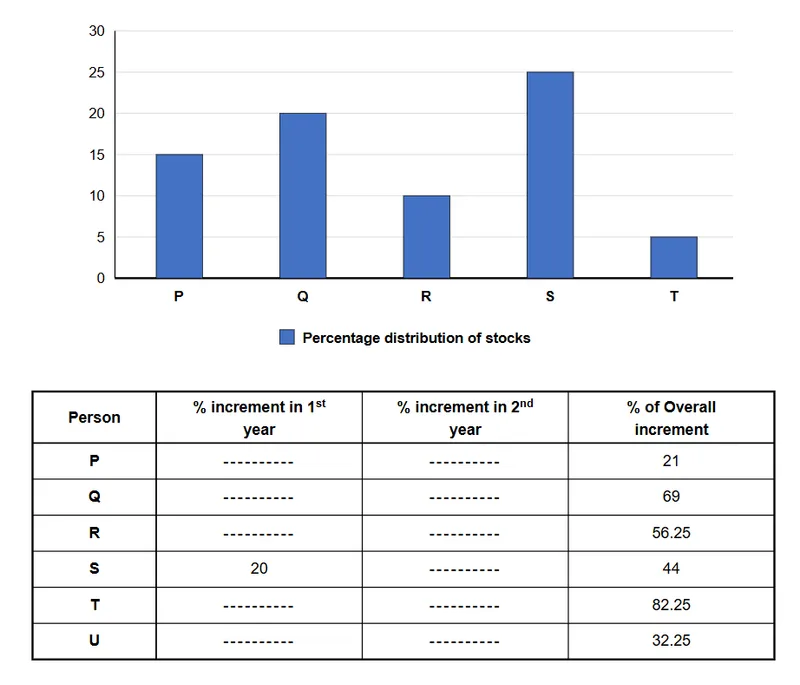
The bar graph shows the percentage distribution of the stocks sold by Ram to six different people(P , Q, R, S, T and U). Total stock value of Ram is Rs. 3,60,000. Table shows the percentage increment in the price of stocks in two years and the overall percentage increment in the price of stocks. Ram earned some return amount from the each person on the increased price.
Note: % increase in Price = % of the return
If the percentage increment for both the years are same for T and S, then find the return from T & S when calulated after 1 year.
Correct Answer :
Rs. 24,300
Solution :
First, let's analyze the given data from the bar graph and the table:
Total stock value of Ram: Rs. 3,60,000
From the bar graph:
- Percentage stock of S = 25%
- Percentage stock of T = 5%
Thus, we can calculate the individual stock values for S and T:
The overall percentage increment over two years is calculated using the successive percentage change formula:
where and represent the percentage increments in the 1st year and 2nd year respectively.
For S:
The table shows the 1st-year increment () is 20% and the overall increment is 44%. Since the percentage increments for both years are same for S:
This is verified by: .
So, the percentage increment for S in the 1st year is 20%.
For T:
The table shows the overall increment is 82.25%. Since the percentage increments for both years are same for T, let the increment for each year be :
Multiplying the entire equation by 100:
Solving the quadratic equation for :
Taking the positive value for the percentage increment:
So, the percentage increment for T in the 1st year is 35%.
Now, we find the return amount from S and T calculated after 1 year:
Access expert-curated educational resources and study materials—completely free.
Create, conduct, and manage professional online assessments with Mindyard. Perfect for teachers and institutes.
Copyright © 2026 Mindyard. All Rights Reserved.




