
Directions (67-69):The radar graph given below shows the number of buckets (plastic + wooden) sold by five different shops (P , Q, R, S and T) in two different months (May and June). Read the data carefully and answer the questions.
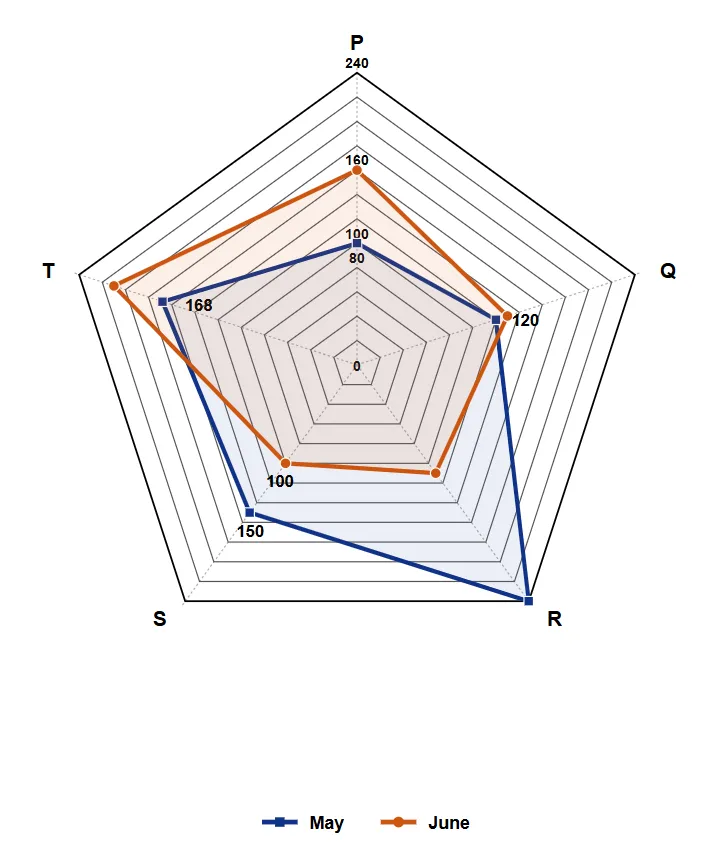
In May, if total number of plastic buckets sold by T are four times of the difference between total number of buckets sold by Q in both months, then find the minimum possible average of total wooden buckets sold by T in May and total plastic buckets sold by T in June (Given, number of wooden buckets sold by T in June > total wooden buckets sold by T in May and it also a perfect square of even number).
Correct Answer :
60
Solution :
Step 1: Extract the relevant data from the radar graph
By analyzing the radar graph, we can find the total number of buckets (plastic + wooden) sold by shops Q and T in the months of May and June:
Step 2: Calculate the number of wooden buckets sold by T in May
The difference between the total number of buckets sold by shop Q in both months is:
According to the question, the total number of plastic buckets sold by T in May is four times this difference:
Using the total buckets sold by T in May (168), we can find the wooden buckets sold by T in May:
Step 3: Apply the constraints for T's sales in June
Let be the number of wooden buckets sold by T in June, and be the number of plastic buckets sold by T in June.
We are given two conditions for :
Step 4: Minimize the average
We want to find the minimum possible average of and :
To minimize this average, we need to minimize the number of plastic buckets sold in June (). Given that:
To minimize , we must maximize to its largest possible value (144):
Now, calculate the minimum average:
Access expert-curated educational resources and study materials—completely free.
Create, conduct, and manage professional online assessments with Mindyard. Perfect for teachers and institutes.
Copyright © 2026 Mindyard. All Rights Reserved.




