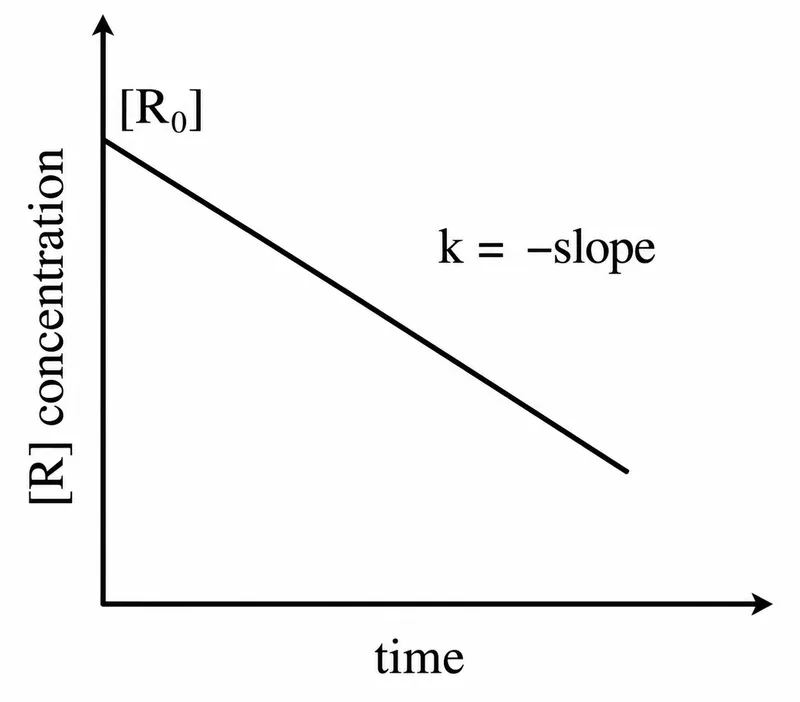
For a certain reaction R → Product, the plot of concentration [R] versus time has a negative slope as shown. The order of reaction is:
Correct Answer :
0
Solution :
The graph provided shows the concentration of reactant plotted against time. The line is a straight line with a constant negative slope, indicating that the concentration decreases linearly as time progresses.
In chemical kinetics, the shape of the versus time plot directly reflects the reaction order:
where is the reaction order.
Zero‑order reaction ():
The rate is independent of the reactant concentration, so . Integrating gives a linear relationship:
This equation describes a straight line with a negative slope on a concentration‑time plot, exactly as seen in the image.
First‑order reaction ():
Leads to an exponential decay: , which would appear as a curve that flattens over time, not a straight line.
Second‑order reaction ():
Gives a hyperbolic decrease: , also not linear.
Fractional order (e.g., 2.5):
Would produce a more complex, non‑linear curve.
Since the observed plot is a straight line with a constant negative slope, the reaction must be zero‑order.
Therefore, the order of the reaction is zero (0).
Access expert-curated educational resources and study materials—completely free.
Create, conduct, and manage professional online assessments with Mindyard. Perfect for teachers and institutes.
Copyright © 2026 Mindyard. All Rights Reserved.