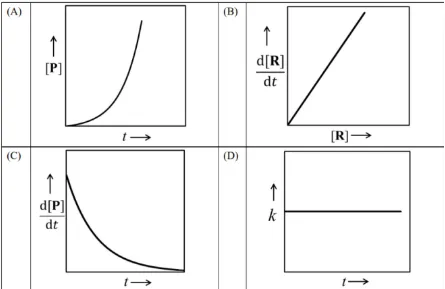
For a first-order reaction R → P at a given temperature, k is the rate constant. For this reaction, at the given temperature, the concentrations of R and P at a time t are [R] and [P], respectively. The correct graphical representation(s) for this reaction is(are)
Correct Answer :
d[P]/dt vs t (decreasing curve)
k vs t (horizontal line)
Solution :
The correct graphical representations for the given first-order reaction are d[P]/dt vs t (decreasing curve) and k vs t (horizontal line).
Step-by-step Analysis and Derivations:
For a first-order reaction with rate constant :
1. Analysis of Rate Constant vs Time (k vs t):
The rate constant of a chemical reaction depends only on temperature and catalyst. It is independent of time or the initial concentration of reactants.
Therefore, a plot of versus is a horizontal straight line parallel to the time axis.
This corresponds to graph (D) shown in the image.
2. Analysis of Rate of Formation vs Time (d[P]/dt vs t):
For a first-order reaction, the rate of disappearance of reactant R or the rate of formation of product P is directly proportional to the concentration of reactant R at that instant:
3. Analysis of Other Graphs for Comparison:
- [P] vs t: The concentration of product P is given by . This is an exponentially increasing curve that approaches asymptotically with a decreasing slope (concave downward), whereas graph (A) shows an upward exponential growth curve, which is incorrect.
- d[R]/dt vs [R]: Graph (B) shows a straight line starting from the origin, but rate of consumption is technically .
Thus, graphs (C) and (D) correctly represent the behavior of the given first-order reaction.
Access expert-curated educational resources and study materials—completely free.
Create, conduct, and manage professional online assessments with Mindyard. Perfect for teachers and institutes.
Copyright © 2026 Mindyard. All Rights Reserved.