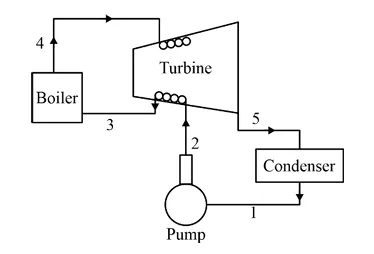
For an ideal regenerative cycle as shown in the figure below, which one of the following is the correct representation of temperature – entropy (T-s) diagram?
Options
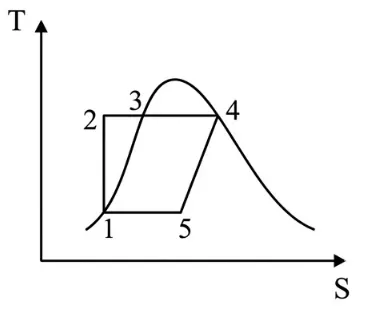
Correct Answer :
Solution :
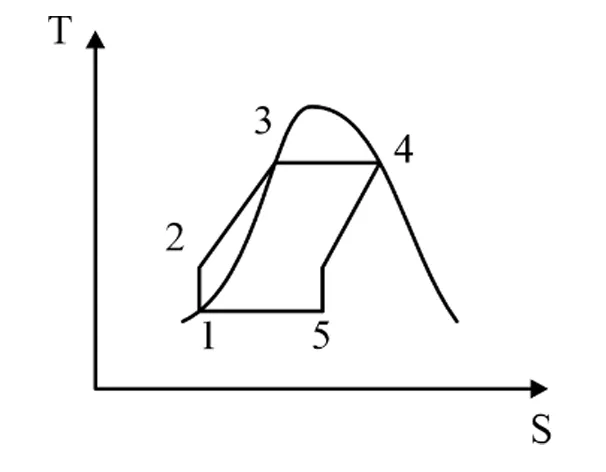
The correct temperature-entropy (T-s) diagram representing the ideal regenerative cycle is the one shown in the first option (Option 1, corresponding to the first diagram).
Detailed Step-by-Step Explanation:
In an ideal regenerative cycle, heat is transferred directly and reversibly from the steam expanding in the turbine to the feedwater flowing in a heat exchanger (coils) inside the turbine casing. We can analyze the cycle by breaking it down into its individual thermodynamic processes:
1. Process 1 – 2: Isentropic Compression in the Pump
Saturated liquid water leaves the condenser at state 1 and enters the pump, where it is compressed reversibly and adiabatically (isentropically) to the boiler pressure at state 2. On the T-s diagram, this is represented by a vertical line:
2. Process 2 – 3: Regenerative Feedwater Heating
The feedwater enters the turbine casing heat exchanger at state 2 and is heated by the expanding steam. In an ideal heat exchanger, the liquid is heated reversibly until it becomes saturated liquid at the boiler pressure (state 3). This process is represented by the curve 2-3, which lies along the saturated liquid line.
3. Process 3 – 4: Evaporation in the Boiler
Saturated liquid at state 3 enters the boiler, where it undergoes phase change (boiling) at constant pressure and temperature to become saturated vapor at state 4. On the T-s diagram, this constant-temperature heat addition is represented by the horizontal line 3-4.
4. Process 4 – 5: Reversible Regenerative Expansion in the Turbine
Saturated steam at state 4 expands in the turbine to state 5 while continuously transferring heat to the feedwater. Since the heat transfer is internally reversible, the heat rejected by the steam at any temperature must be equal to the heat absorbed by the feedwater at the same temperature:
5. Process 5 – 1: Heat Rejection in the Condenser
The steam at state 5 enters the condenser, where it rejects heat at constant pressure and temperature to the cooling water, condensing back to saturated liquid at state 1. This constant-temperature condensation is represented by the horizontal line 5-1.
Summary of Options:
• Option 1 (Correct): Correctly shows the curves 2-3 and 4-5 as parallel curves on the T-s diagram, representing the equal and opposite entropy changes of the feedwater and expanding steam.
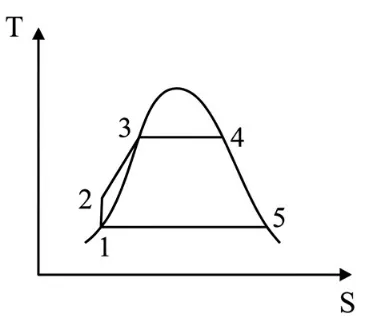
• Option 2: Incorrectly shows curve 4-5 sloping down and to the right, which would imply an increase in steam entropy (heat addition to the steam).
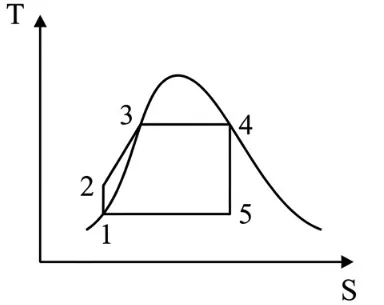
• Option 3: Incorrectly shows curve 4-5 as a vertical line (isentropic expansion with no heat transfer), which represents a simple Rankine cycle without regeneration.
• Option 4: Incorrectly shows the pump outlet state 2 reaching the boiler temperature directly, which is physically impossible for a pump process.
Access expert-curated educational resources and study materials—completely free.
Create, conduct, and manage professional online assessments with Mindyard. Perfect for teachers and institutes.
Copyright © 2026 Mindyard. All Rights Reserved.