
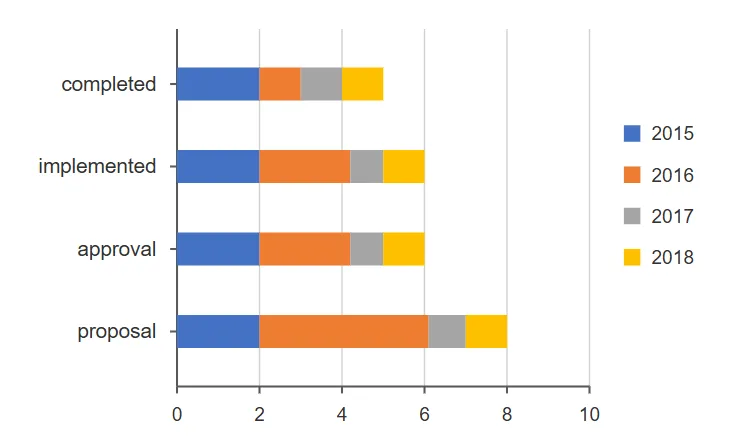
A company starts constructing buildings for a college. The constructions have 4 stages.
The above 3D-bar graph indicates the status of constructions for 4 years 2015 to 2018.
The X-axis scale 0, 2, 4, 6, 8, 10 indicates 0, 20%, 40%, 60%, 80%, 100%.
Study the bar graph carefully and answer the following question.
Find the total percentage of buildings completed during the total period, 2015 to 2018.
Correct Answer :
50%
Solution :
Correct Answer: 50%
To find the total percentage of buildings completed during the period 2015 to 2018, we analyze the data from the horizontal stacked bar graph provided in the question:

1. Understanding the Scale:
The scale on the X-axis ranges from 0 to 10. As given in the problem text, each step of 2 units on the scale represents 20% (or 1 unit = 10%). Therefore, a total value of 10 units on the bar graph corresponds to 100% of the maximum scale, and a bar length of 5 units represents 50%.
2. Analyzing the "completed" Bar:
Looking at the topmost horizontal bar labeled completed:
- Blue segment (2015): 0 to 2 units
- Orange segment (2016): 2 to 3 units (1 unit)
- Grey segment (2017): 3 to 4 units (1 unit)
- Yellow segment (2018): 4 to 5 units (1 unit)
The total length of the bar for completed buildings spans from 0 to 5 units on the grid line.
3. Calculating the Percentage:
Since 10 units represent 100% on the given X-axis scale, 5 units correspond to:
Thus, the total percentage of buildings completed during the total period from 2015 to 2018 is 50%.
Access expert-curated educational resources and study materials—completely free.
Create, conduct, and manage professional online assessments with Mindyard. Perfect for teachers and institutes.
Copyright © 2026 Mindyard. All Rights Reserved.




