
The following bar graph indicates the demand and production (in hundreds) of 5 companies A, B, C, D and E. X-axis indicates the demand and production (in hundreds) and Y-axis indicates the companies. Study the bar graph carefully and answer the question that follows.
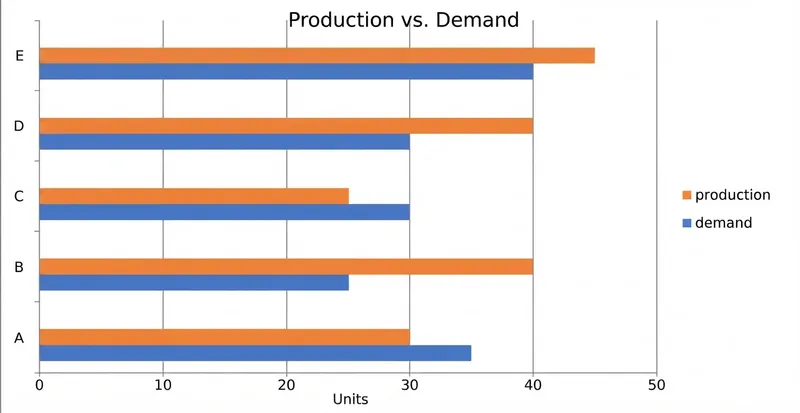
Find the difference between the average demand and average production of the five companies taken together.
Correct Answer :
400
Solution :
The correct answer is 400.

From the given bar graph, the X-axis represents the demand and production values (in hundreds) and the Y-axis lists the five companies (A, B, C, D, and E). The blue bars represent demand and the orange bars represent production.
By inspecting the graph, the values (in hundreds) for each company are:
- Company A: Demand = 35, Production = 30
- Company B: Demand = 25, Production = 40
- Company C: Demand = 30, Production = 25
- Company D: Demand = 30, Production = 40
- Company E: Demand = 40, Production = 45
Step 1: Calculate Total Demand and Total Production for all 5 companies.
Step 2: Find the Average Demand and Average Production.
Step 3: Calculate the difference between average production and average demand.
Converting 4 (in hundreds) into absolute units:
Therefore, the difference between the average demand and average production of the five companies taken together is 400.
Access expert-curated educational resources and study materials—completely free.
Create, conduct, and manage professional online assessments with Mindyard. Perfect for teachers and institutes.
Copyright © 2026 Mindyard. All Rights Reserved.




