In a conductometric titration, small volume of titrant of higher concentration is added stepwise to a larger volume of titrate of much lower concentration, and the conductance is measured after each addition.
The limiting ionic conductivity (Λ0) values (in mS m2 mol−1) for different ions in aqueous solutions are given below:
| Ions | |||||||||
| 6.2 | 7.4 | 5.0 | 35.0 | 7.2 | 7.6 | 16.0 | 19.9 | 4.1 |
For different combinations of titrates and titrants given in List-I, the graphs of ‘conductance’ versus ‘volume of titrant’ are given in List-II.
Match each entry in List-I with the appropriate entry in List-II and choose the correct option
| List-I | List-II |
| (P) Titrate: KCl Titrant: AgNO3 |
(1) 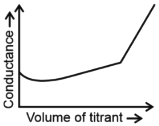 |
| (Q) Titrate: AgNO3 Titrant: KCl |
(2) 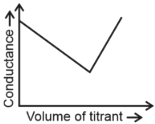 |
| (R) Titrate: NaOH Titrant: HCl |
(3) 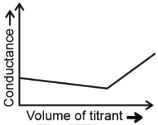 |
| (S) Titrate: NaOH Titrant: CH3COOH |
(4) 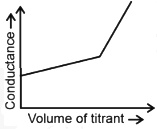 |
(5) 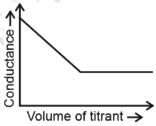 |
Correct Answer :
P-3, Q-4, R-2, S-5
Solution :
The correct option is P-3, Q-4, R-2, S-5.
Analysis of the Limiting Ionic Conductivity ():
Based on the provided table:
• = 35.0 mS m2 mol−1
• = 19.9 mS m2 mol−1
• = 7.6 mS m2 mol−1
• = 7.4 mS m2 mol−1
• = 7.2 mS m2 mol−1
• = 6.2 mS m2 mol−1
• = 5.0 mS m2 mol−1
• = 4.1 mS m2 mol−1
Step-by-Step Matching of the Titrations:
1. Combination (P): Titrate = KCl, Titrant = AgNO3
• Reaction:
• Before equivalence: Highly mobile ions () are precipitated as solid AgCl and replaced by slightly less mobile ions (). The concentration of remains unchanged. Consequently, the conductance decreases very slightly.
• After equivalence: Excess is added, contributing mobile (6.2) and (7.2) ions, which causes a steady increase in conductance.
• This matches the graph where the conductance decreases slightly and then increases, corresponding to (3) (Image 2).
2. Combination (Q): Titrate = AgNO3, Titrant = KCl
• Reaction:
• Before equivalence: ions () are precipitated and replaced by slightly more mobile ions (). The concentration of remains unchanged. Therefore, the conductance increases slightly.
• After equivalence: Excess KCl is added, introducing highly mobile (7.4) and (7.6) ions, which results in a steeper increase in conductance.
• This matches the graph where conductance increases slowly and then increases with a steeper slope, corresponding to (4) (Image 3).
3. Combination (R): Titrate = NaOH, Titrant = HCl
• Reaction:
• Before equivalence: The highly conducting ions () are replaced by less conducting ions (). Thus, the conductance decreases sharply.
• After equivalence: Excess HCl is added, introducing highly conducting ions () and (7.6) ions, causing the conductance to rise steeply.
• This matches the classic V-shaped curve, corresponding to (2) (Image 1).
4. Combination (S): Titrate = NaOH, Titrant = CH3COOH
• Reaction:
• Before equivalence: Highly mobile ions () are replaced by poorly conducting acetate ions, (). This results in a sharp decrease in conductance.
• After equivalence: Excess weak acid is added. Because of the common ion effect from the acetate salt, the dissociation of this weak acid is heavily suppressed. Consequently, the conductance remains nearly constant.
• This matches the graph where the conductance decreases and then levels off, corresponding to (5) (Image 4).
Conclusion:
Matching the pairs yields:
• P → 3
• Q → 4
• R → 2
• S → 5
Access expert-curated educational resources and study materials—completely free.
Create, conduct, and manage professional online assessments with Mindyard. Perfect for teachers and institutes.
Copyright © 2026 Mindyard. All Rights Reserved.