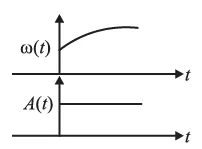
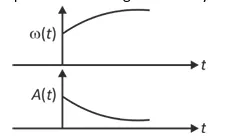
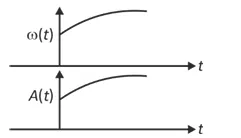
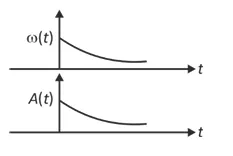
In an oscillating spring mass system, a spring is connected to a box filled with sand. As the box oscillates, sand leaks slowly out of the box vertically so that the average frequency ω(t) and average amplitude A(t) of the system change with time t. Which one of the following options schematically depicts these changes correctly?
Options
 .
.
 .
.
 .
.
 .
.
Correct Answer :
.
Solution :
The correct option is Option 2 (represented by the second graph, where the frequency increases and the amplitude decreases over time).
1. Behavior of the Average Frequency :
The angular frequency of an oscillating spring-mass system is given by the formula:
where:
- is the spring constant (which remains constant).
- is the instantaneous mass of the box and the sand inside it.
As the sand leaks out slowly from the box, the total mass of the system decreases with time. Since the frequency is inversely proportional to the square root of the mass, a decrease in mass results in an increase in the average frequency . Once the sand completely leaks out, the frequency plateaus at a constant value corresponding to the mass of the empty box.
2. Behavior of the Average Amplitude :
As the box oscillates, sand leaks out vertically. Because it drops out at the same instantaneous velocity as the box, each escaping grain of sand carries away its own kinetic energy. The loss of energy over an infinitesimal mass change is:
Averaging this loss over a complete cycle of oscillation, where the average kinetic energy equals half the total energy (), we get:
Integrating this differential equation:
Since the total mechanical energy of the system is also related to the amplitude by , we have:
Since the mass decreases over time, the average amplitude must decrease.
3. Graphic Representation:
- Option 1 (image_0.webp): Shows increasing and remaining constant.
- Option 2 (image_1.webp): Shows increasing and decreasing over time.
- Option 3 (image_2.webp): Shows both and increasing.
- Option 4 (image_3.webp): Shows both and decreasing.
Thus, the trends of increasing frequency and decreasing amplitude are correctly depicted in Option 2.
Access expert-curated educational resources and study materials—completely free.
Create, conduct, and manage professional online assessments with Mindyard. Perfect for teachers and institutes.
Copyright © 2026 Mindyard. All Rights Reserved.