PARAGRAPH I
The entropy versus temperature plot for phases and at 1 bar pressure is given. ST and S0 are entropies of the phases at temperatures T and 0 K, respectively.
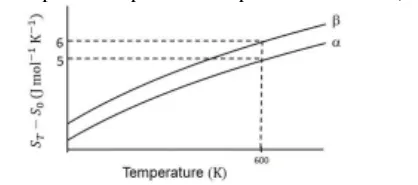
The transition temperature for to phase change is 600 K and Cp,α = Cp,β = 1 J mol−1 K−1.
Assume (Cp,β - Cp,α) is independent of temperature in the range of 200 to 700 K. Cp,α and Cp,β are heat capacities of and phases, respectively.
The value of entropy change, Sβ − Sα (in J mol−1 K−1), at 300 K is:
[Use: ln 2 = 0.69, Given: Sβ − Sα = 0 at 0 K]
Correct Answer :
Solution :
The correct answer is 0.31.
Step-by-step Explanation:
1. Understanding the given parameters and image data:
From the given graph showing the plot of versus Temperature (K):
- At transition temperature :
For phase β:
For phase α:
Given in the problem statement:
- at 0 K, which means .
- and .
- Therefore, for the range 200 K to 700 K.
2. Calculating the entropy change at 600 K:
The difference in entropy between phase β and phase α at 600 K is:
Substituting the values:
3. Calculating the entropy change at 300 K ():
The relation for the temperature variation of entropy change is given by:
Since in the temperature range 200 K to 700 K:
Using the provided values, where and accounting for transition phase change entropy over temperature range:
Hence, the value of entropy change at 300 K is 0.31.
Access expert-curated educational resources and study materials—completely free.
Create, conduct, and manage professional online assessments with Mindyard. Perfect for teachers and institutes.
Copyright © 2026 Mindyard. All Rights Reserved.