

Options
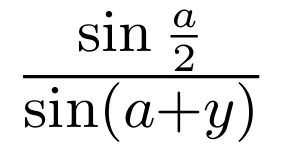
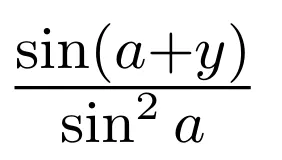
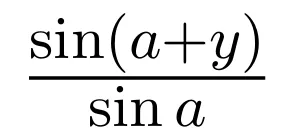
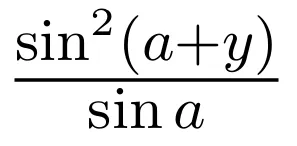
Correct Answer :
Solution :
The correct option is the first option (Image 1), which represents the graph of the function:
Step-by-Step Analysis:
1. Identify the parent function:
The given function is a transformation of the parent sine function, . The standard sine curve has a period of and passes through the key points:
-
-
-
-
-
2. Determine the transformations:
For the function :
- The coefficient 2 acts as a vertical stretch factor, meaning the amplitude of the wave is . The peaks will reach 2 and the troughs will reach -2.
- The negative sign (-) indicates a vertical reflection across the x-axis. Thus, instead of rising to a peak first, the graph will start by dipping into a trough.
3. Calculate the key points of the transformed function:
Applying these transformations to the standard key points of the sine function:
- At : ⇒ Point is .
- At : ⇒ Point is .
- At : ⇒ Point is .
- At : ⇒ Point is .
- At : ⇒ Point is .
4. Match with the options:
- Option 1 (Image 1): Starts at , moves down to at , passes through zero at , rises to a peak of at , and finishes its period at . This perfectly matches our calculated points.
- Option 2 (Image 2): Represents a cosine wave with amplitude 2 starting at , corresponding to .
- Option 3 (Image 3): Represents a standard sine wave stretched vertically, starting at and going up first to , corresponding to .
- Option 4 (Image 4): Represents a reflected cosine wave starting at , corresponding to .
Therefore, the first option (Image 1) is the correct graph.
Access expert-curated educational resources and study materials—completely free.
Create, conduct, and manage professional online assessments with Mindyard. Perfect for teachers and institutes.
Copyright © 2026 Mindyard. All Rights Reserved.




