
Study the given bar-graph and answer the question that follows. The bar-graph shows the production (in lakh) of kitchen appliances manufactured by three companies A, B, and C over a period of six years from 2012 to 2017.
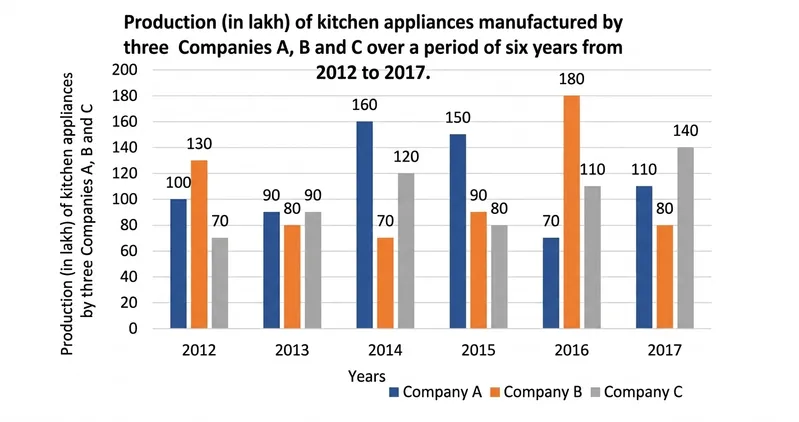
What is the difference (in lakh) between the average production of company B during the period 2012 to 2017 and the combined average of the production of company A in 2012, 2014, 2015 and the production of company C in 2014, 2016 and 2017, respectively?
Correct Answer :
25
Access expert-curated educational resources and study materials—completely free.
Create, conduct, and manage professional online assessments with Mindyard. Perfect for teachers and institutes.
Copyright © 2026 Mindyard. All Rights Reserved.




