
Study the given bar-graph and answer the question that follows.
An electric vehicle company produces three different car models – A, B and C. The production of three different models over a period of four years (in lakhs) has been shown the bar-graph.
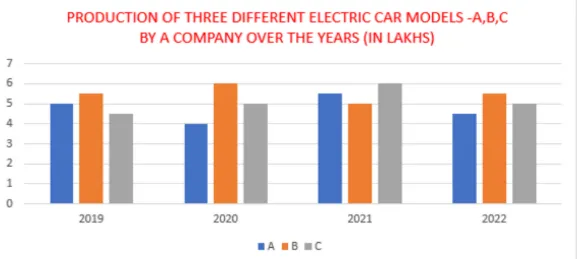
The total production of model C in 2021 and 2022 is what percentage of the total production of model A in 2019 and 2020?
Correct Answer :
122.22%
Access expert-curated educational resources and study materials—completely free.
Create, conduct, and manage professional online assessments with Mindyard. Perfect for teachers and institutes.
Copyright © 2026 Mindyard. All Rights Reserved.




