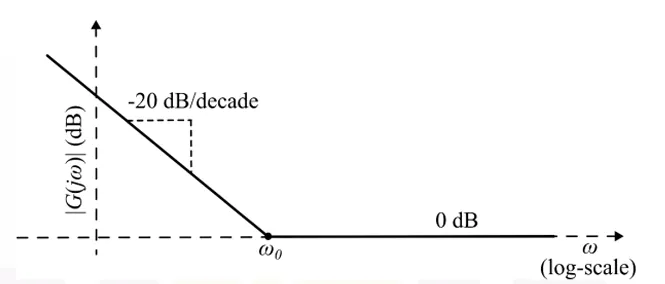
The asymptotic Bode magnitude plot of a system is shown. Which one of the following options best represents the transfer function of the system?
Correct Answer :
Solution :
The correct answer is:
Analysis of the Bode Plot:
By inspecting the provided asymptotic Bode magnitude plot, we observe two main frequency regions separated by the corner frequency, which is labeled as :
1. For high frequencies (), the magnitude plot is flat at a constant level of .
2. For low frequencies (), the asymptote has a slope of when moving from low frequencies up towards , representing a transition region where the magnitude changes with frequency.
Mathematical Derivation:
Let us evaluate the frequency response of the transfer function by substituting :
Now, we look at the asymptotic behavior in the two frequency limits:
Case 1: High-Frequency region ()
When the frequency is much higher than the corner frequency, the term dominates over in the denominator:
The magnitude in decibels in this region is:
This perfectly matches the flat asymptote of for frequencies above shown in the plot.
Case 2: Low-Frequency region ()
When the frequency is much lower than the corner frequency, the term is much smaller than , so the denominator is approximately :
The magnitude in decibels in this region is:
This mathematical form represents a straight line on a logarithmic scale with a slope of as frequency increases towards . Correspondingly, as frequency decreases away from , the magnitude rolls off at a rate of . Thus, the transfer function matching this behavior is indeed:
Access expert-curated educational resources and study materials—completely free.
Create, conduct, and manage professional online assessments with Mindyard. Perfect for teachers and institutes.
Copyright © 2026 Mindyard. All Rights Reserved.