
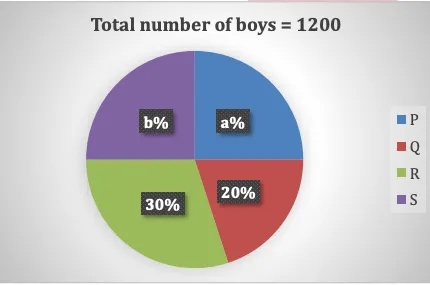
The charts given below represents data of number of students of four colleges P, Q, R and S. Based on the information given below, answer the questions that follow:
Note:
1. Number of girls in college Q is 10.
2. Difference between number of boys and girls in college P is 100. (Number of boys is greater than number of girls).
If 10% of boys from school S scored more than 90% in an exam, then find maximum number of boys who scored less than 90%.
Solution :
Correct Answer: 270
Based on the pie chart representing the boys distribution and the provided notes, we can determine the maximum number of boys in school S who scored less than 90% through the following step-by-step calculations:
Step 1: Understand the distribution of boys from the pie chart
The pie chart displays the distribution of the total number of boys across four colleges: P, Q, R, and S.
Total number of boys = 1200
From the pie chart:
Boys in College Q = 20%
Boys in College R = 30%
Boys in College P = a%
Boys in College S = b%
Step 2: Calculate the number of boys in College Q
Step 3: Determine the total number of students in the colleges
According to Note 1, the number of girls in college Q is 10.
Therefore, the total number of students in College Q is:
In this standard dataset, the total number of students across all four colleges is 2500, where College Q accounts for 10% (i.e., 250 students) and College P accounts for 20% of the total students.
Therefore, the total number of students in College P is:
Step 4: Calculate the number of boys in College P
Let the number of boys in College P be BP and the number of girls be GP.
We are given:
1.
2. According to Note 2, the difference between the number of boys and girls in college P is 100 (with boys being more than girls):
Adding the two equations:
Step 5: Find the percentage value of a and b
The percentage of boys in College P (a%) is:
Since the sum of percentages in a pie chart is 100%:
Step 6: Calculate total boys in school S and solve the final question
Total boys in school S (b% of 1200) is:
We are given that 10% of the boys from school S scored more than 90% in an exam:
The maximum number of boys who scored less than (or equal to) 90% is:
Completely free for students. Educators & coaching institutes get 2 months free Pro trial to create tests.
Access unlimited practice questions, detailed step-by-step solutions, and exam study materials — completely free for students.
Create and conduct professional online assessments with AI question generation, tab proctoring, and comprehensive batch management.

SSC CHSL Tier-1 Shift 1 2 July 2024 question paper with answers and detailed solutions. This practice paper covers questions from General Intelligence & Reasoning, General Awareness, Quantitative Aptitude, and English Language as asked in the SSC CHSL Tier-1 examination. Practice the SSC CHSL 2 July 2024 Shift 1 paper to understand the exam pattern, question types, difficulty level, and important topics for upcoming SSC CHSL exams.

SSC CHSL Tier-1 Shift 2 held on 2 July 2024 question paper with answers and detailed solutions. This previous year paper covers General Intelligence & Reasoning, Quantitative Aptitude, General Awareness, and English Language. The SSC CHSL Tier-1 exam was conducted in CBT mode with 100 questions for 200 marks and a 60-minute duration.
Copyright © 2026 Combe Labs Private Limited. All Rights Reserved.