
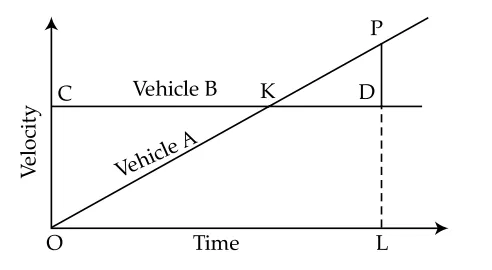
The figure drawn below gives the velocity graphs of two vehicles A and B. The straight of two vehicles A and B. The straight line OKP represents the velocity of vehicle A at any instant, whereas the horizontal straight line CKD represents the velocity of vehicle B at any instant. In the figure, D is the point where perpendicular from P meets the horizontals line CKD such that .
What is the ratio between the distances covered by vehicles A and B in the time interval OL?
Correct Answer :
3 : 4
Solution :
The correct answer is 3 : 4.
Let us carefully read the velocity-time graph shown in the figure. The graph has Time on the horizontal axis and Velocity on the vertical axis. The key features visible in the image are:
• Point O is the origin (time = 0, velocity = 0).
• Line OKP is a straight line starting from the origin O, passing through point K, and ending at point P — this represents Vehicle A, which starts from rest and accelerates uniformly (velocity increases linearly with time).
• Line CKD is a horizontal straight line — this represents Vehicle B, which moves at a constant velocity throughout.
• Point K is where the two lines intersect — both vehicles have the same velocity at this instant.
• Point L is on the time axis directly below point P (and D), marking the end of the time interval we are interested in.
• Point D is on the horizontal line CKD, directly above L, where the perpendicular from P meets the line CKD.
• It is given that .
Let us now assign variables. Let the constant velocity of Vehicle B (the height of line CKD above the time axis) be . Since P is above D by a length PD, and D is the foot of the perpendicular from P on line CKD, the velocity of Vehicle A at time OL equals:
where PL is the full height of P above the time axis (i.e., the velocity of Vehicle A at time OL), PD is the extra height above line CKD, and DL = OC = the constant velocity of B.
Using the given condition :
Let the constant velocity of Vehicle B = (the vertical distance from the time axis to line CKD, same as OC).
Then:
So the velocity of Vehicle A at time OL (which equals PL = PD + DL) is:
Now, finding the distances covered in time interval OL:
In a velocity-time graph, the distance covered equals the area under the velocity-time curve.
Distance covered by Vehicle A in time OL:
Vehicle A starts from rest (velocity = 0 at O) and reaches velocity at time OL. Its velocity-time graph is a straight line through the origin (line OKP), so the area under it is a triangle:
Distance covered by Vehicle B in time OL:
Vehicle B moves at a constant velocity throughout the interval OL. Its velocity-time graph is a horizontal line, so the area under it is a rectangle:
Finding the ratio SA : SB:
Therefore, the ratio of the distance covered by Vehicle A to the distance covered by Vehicle B in the time interval OL is:
This result makes intuitive sense: Vehicle A starts from rest and only gradually speeds up, so even though it eventually exceeds the velocity of B (since PL = 3v/2 > v), it spends a large portion of the journey at lower speeds. Meanwhile, Vehicle B maintains a steady, efficient velocity throughout — enabling it to cover more ground overall in the same time interval.
Access expert-curated educational resources and study materials—completely free.
Create, conduct, and manage professional online assessments with Mindyard. Perfect for teachers and institutes.
Copyright © 2026 Mindyard. All Rights Reserved.




