The figure shows a thin-walled open-top cylindrical vessel of radius 𝑟 and wall thickness 𝑡. The vessel is held along the brim and contains a constant-density liquid to height ℎ from the base. Neglect atmospheric pressure, the weight of the vessel and bending stresses in the vessel walls.
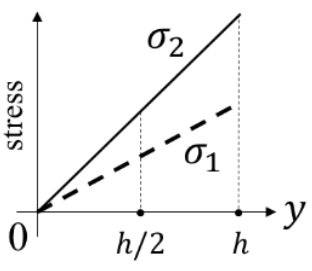
Which one of the plots depicts qualitatively CORRECT dependence of the magnitudes of axial wall stress (σ1) and circumferential wall stress (σ2) on 𝑦?
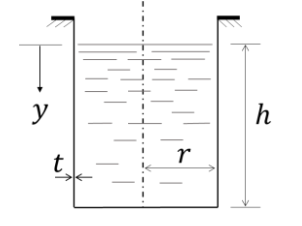
Options
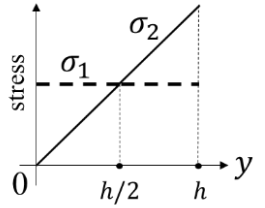
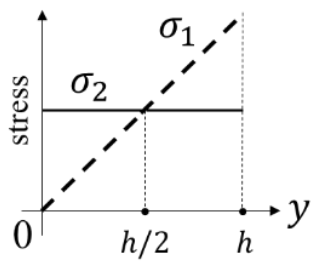
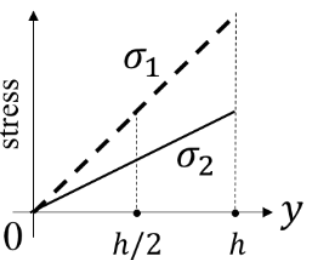
Correct Answer :
Solution :
The correct option is the plot shown in Image 1 (where the axial stress is represented by a constant horizontal dashed line, and the circumferential stress is represented by a linearly increasing solid line starting from zero and intersecting at ).
1. Calculation of Axial Stress ():
The cylindrical vessel is open at the top and held securely along its brim. The total weight of the liquid contained in the vessel up to height h is supported entirely by the cylinder walls.
Let (or ) be the unit weight of the liquid, where is the density and is the acceleration due to gravity.
The total weight of the liquid is given by:
At any horizontal cross-section at a depth y from the liquid surface, the entire weight of the liquid below that section is transmitted to the bottom plate, which is in turn supported by the cylinder walls. Since the vessel is suspended from its brim, the vertical tension force in the vessel wall at any section y (within the wet region ) is constant and equal to the total weight of the liquid, .
Thus, the axial tensile stress in the thin-walled cylinder of radius r and thickness t is:
Since is independent of y, it is constant along the height of the cylinder wall and appears as a horizontal line.
2. Calculation of Circumferential (Hoop) Stress ():
The circumferential (hoop) stress is caused by the internal radial pressure exerted by the liquid. At any depth y from the free surface of the liquid, the gauge pressure is given by:
For a thin-walled cylinder, the hoop stress is calculated as:
This shows that increases linearly with depth y, starting from zero at the free surface ().
3. Analyzing the Intersection Point:
To find the depth y where the axial and hoop stresses are equal ():
Solving for y gives:
At , the circumferential stress reaches its maximum value:
Therefore, the plot must show:
• A constant horizontal dashed line for the axial stress at a value of .
• A linearly increasing solid line for the hoop stress starting from the origin and intersecting the line precisely at .
This matches the plot in Image 1.
Access expert-curated educational resources and study materials—completely free.
Create, conduct, and manage professional online assessments with Mindyard. Perfect for teachers and institutes.
Copyright © 2026 Mindyard. All Rights Reserved.