
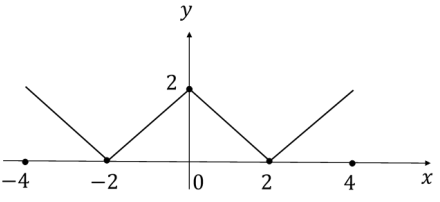
The figure shows the plot of a function over the interval [-4, 4]. Which one of the options given CORRECTLY identifies the function?
Correct Answer :
|2 − |𝑥| |
Solution :
The correct option is: |2 − |𝑥||
Step-by-Step Explanation:
To identify the correct function representing the given graph, we can analyze the key features of the plot, such as its symmetry, intercepts, and value at specific points, or trace the function's behavior step-by-step.
1. Identify Key Points from the Graph:
By observing the provided image, we can identify several distinct points on the plotted curve over the interval [-4, 4]:
• The y-intercept is at:
which means when
,
we must have
.
• The x-intercepts (where the curve touches the x-axis) are at:
and
,
meaning
at
.
• The endpoints of the plotted interval at
both have a y-value of 2, corresponding to the coordinates:
and
.
2. Analyze Symmetry:
The graph is symmetric about the y-axis. This indicates that the function is an even function, satisfying:
Functions that contain
instead of just
naturally display this symmetry. This makes
,
,
and
potential candidates, while eliminating
(which is not symmetric about the y-axis).
3. Test the Candidates with Key Points:
Let us test the remaining functions using the coordinates identified from the graph:
Candidate A:
• If we plug in
:
But the graph shows
at
. Thus, this option is incorrect.
Candidate B:
• If we plug in
:
But the graph shows
at
. Thus, this option is also incorrect.
Candidate C (Correct Option):
• Let's verify all identified points:
- For
:
(Matches the graph)
- For
:
(Matches the graph)
- For
:
(Matches the graph)
Thus, the function is correctly identified as |2 − |𝑥||.
Access expert-curated educational resources and study materials—completely free.
Create, conduct, and manage professional online assessments with Mindyard. Perfect for teachers and institutes.
Copyright © 2026 Mindyard. All Rights Reserved.




