
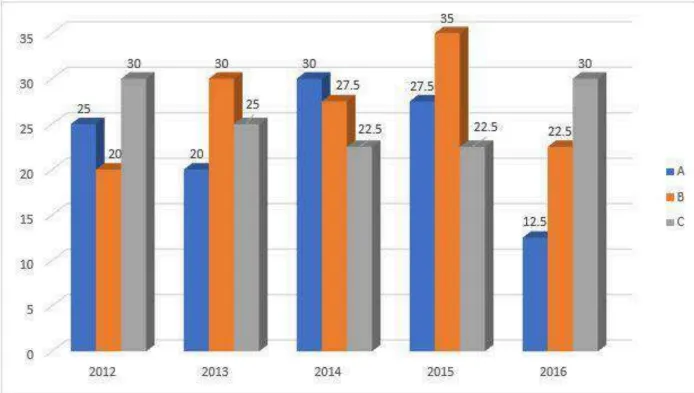
The following bar graph represents the production of three types of buses by a company over the years (in thousands).
In which of the following years was the percentage production of B type buses to C type buses, the maximum?
Correct Answer :
2015
Solution :
The correct answer is 2015.
To find the year in which the percentage production of B type buses to C type buses was the maximum, we calculate the percentage for each year given in the options using the formula:
From the given bar graph, the values for production of B type and C type buses (in thousands) for the given years are as follows:
1. For the year 2013:
Production of B type buses = 30
Production of C type buses = 25
2. For the year 2014:
Production of B type buses = 27.5
Production of C type buses = 22.5
3. For the year 2015:
Production of B type buses = 35
Production of C type buses = 22.5
4. For the year 2016:
Production of B type buses = 22.5
Production of C type buses = 30
Comparing the percentages obtained above, the percentage production of B type buses to C type buses was maximum in the year 2015 (155.56%).
Access expert-curated educational resources and study materials—completely free.
Create, conduct, and manage professional online assessments with Mindyard. Perfect for teachers and institutes.
Copyright © 2026 Mindyard. All Rights Reserved.




