The following graph indicates the composition of our tax revenue for a period of two decades:
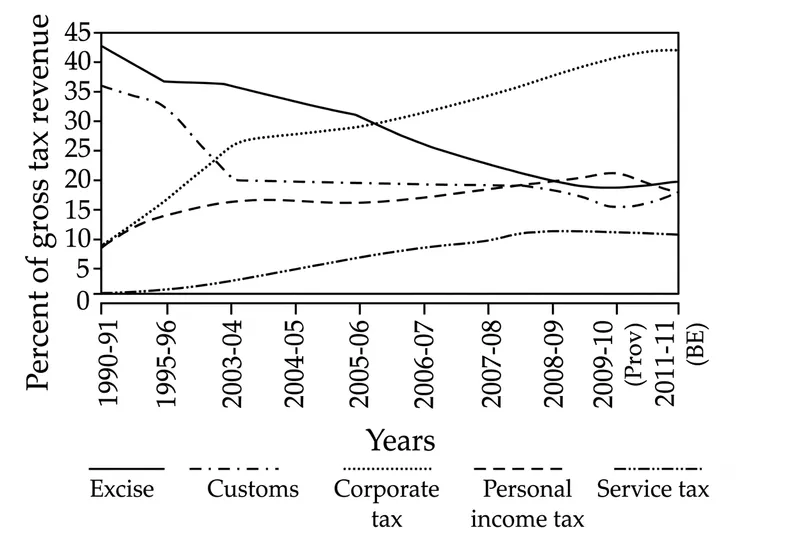
With reference to the above graph, which of the following is/are the most logical and rational inference/ inferences that can be made?
1. During the given period, the revenue from Direct Taxes as percentage of gross tax revenue has increased while that of Indirect Taxes decreased.
2. The trend in the revenue from Excise Duty demonstrates that the growth of manufacturing sector has been negative during the given period.
Select the correct answer using the code given below.
Correct Answer :
1 only
Solution :
The correct option is 1 only.
Analysis of the Graph:
The provided graph displays the composition of gross tax revenue as a percentage over two decades, from the fiscal year 1990-91 to 2011-12. The y-axis shows the Percent of gross tax revenue ranging from 0 to 45, and the x-axis shows the Years. The five categories of taxes tracked in the graph are:
1. Excise Duty (represented by the solid line)
2. Customs Duty (represented by the dash-dot-dot line)
3. Corporate Tax (represented by the dotted line)
4. Personal Income Tax (represented by the dashed line)
5. Service Tax (represented by the dash-dot line)
To analyze the inferences, we must first categorize these taxes into Direct and Indirect Taxes:
- Direct Taxes: Corporate Tax and Personal Income Tax.
- Indirect Taxes: Excise Duty, Customs Duty, and Service Tax.
Step-by-Step Verification of Statement 1:
Let us compare the percentage contribution of Direct and Indirect Taxes at the beginning and the end of the given period:
At the beginning of the period (1990-91):
- Corporate Tax: Approximately 9%
- Personal Income Tax: Approximately 9%
- Total Direct Taxes:
- Excise Duty: Approximately 43%
- Customs Duty: Approximately 36%
- Service Tax: Approximately 0%
- Total Indirect Taxes:
At the end of the period (2011-12):
- Corporate Tax: Approximately 42%
- Personal Income Tax: Approximately 18%
- Total Direct Taxes:
- Excise Duty: Approximately 20%
- Customs Duty: Approximately 18%
- Service Tax: Approximately 11%
- Total Indirect Taxes:
Since the contribution of Direct Taxes increased from 18% to 60%, and that of Indirect Taxes decreased from 79% to 49%, Statement 1 is a correct and logical inference.
Step-by-Step Verification of Statement 2:
Statement 2 suggests that the decreasing trend of Excise Duty indicates negative growth in the manufacturing sector. This inference is incorrect for the following reasons:
- The graph shows the relative share (percentage of gross tax revenue) rather than absolute revenue collected or manufacturing output.
- A decline in the share of Excise Duty can happen due to high growth in other tax streams (like Corporate Tax and Service Tax), or due to reductions in excise tax rates, even if the manufacturing sector itself is growing positively in absolute terms.
- Therefore, we cannot infer that the growth of the manufacturing sector has been negative solely from this relative percentage trend. Thus, Statement 2 is incorrect.
Conclusion:
Since only Statement 1 is correct, the correct option is 1 only.
Access expert-curated educational resources and study materials—completely free.
Create, conduct, and manage professional online assessments with Mindyard. Perfect for teachers and institutes.
Copyright © 2026 Mindyard. All Rights Reserved.