
The following graph shows the sale of few items of a garment company for three months.
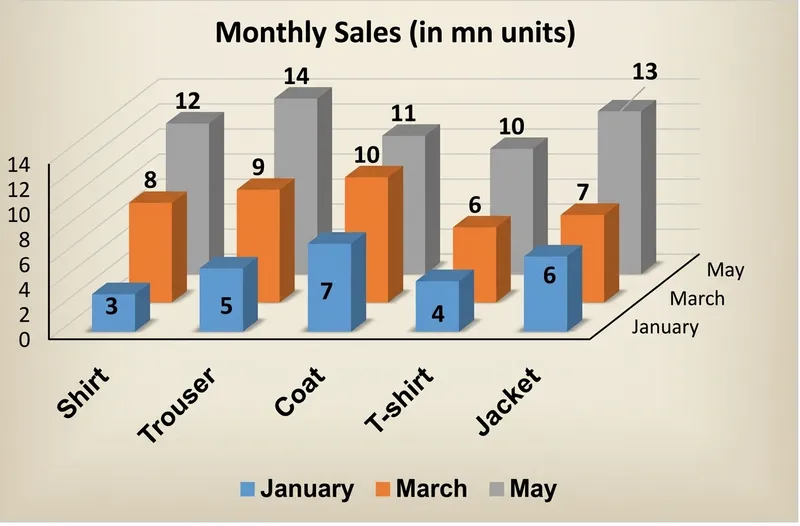
What is the percentage of the sale of the least selling item in the three months over the total sale of the company?
Correct Answer :
16%
Solution :
The correct option is 16%.
From the given graph titled "Monthly Sales (in mn units)", we can observe the sales of five different garment items (Shirt, Trouser, Coat, T-shirt, and Jacket) over three months (January, March, and May):
1. Sales for each garment item across the three months:
• Shirt: January = 3, March = 8, May = 12
Total Shirt Sales = 3 + 8 + 12 = 23 mn units
• Trouser: January = 5, March = 9, May = 14
Total Trouser Sales = 5 + 9 + 14 = 28 mn units
• Coat: January = 7, March = 10, May = 11
Total Coat Sales = 7 + 10 + 11 = 28 mn units
• T-shirt: January = 4, March = 6, May = 10
Total T-shirt Sales = 4 + 6 + 10 = 20 mn units
• Jacket: January = 6, March = 7, May = 13
Total Jacket Sales = 6 + 7 + 13 = 26 mn units
2. Identification of the least selling item:
Comparing the total sales for each item:
Shirt = 23 mn units
Trouser = 28 mn units
Coat = 28 mn units
T-shirt = 20 mn units
Jacket = 26 mn units
The item with the lowest total sales is the T-shirt, with a total of 20 mn units.
3. Total sales of the company across all items:
4. Percentage of the sale of the least selling item over total sales:
Thus, the percentage of the sale of the least selling item in the three months over the total sale of the company is 16%.
Access expert-curated educational resources and study materials—completely free.
Create, conduct, and manage professional online assessments with Mindyard. Perfect for teachers and institutes.
Copyright © 2026 Mindyard. All Rights Reserved.




