The following plots show variation of velocity (v), with time (t), of a ball thrown vertically upward, and falling back. Which of the following plots is/are correct?
Options
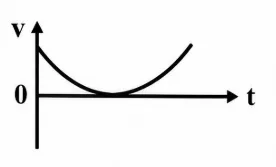
Correct Answer :
Solution :
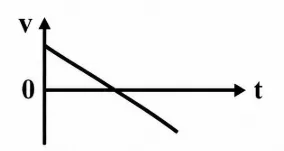
The correct answer is plot (c), which corresponds to the third option.
Let us analyze the motion of a ball thrown vertically upward and falling back under the influence of gravity:
1. Equations of Motion:
Let the upward direction be chosen as the positive direction. When the ball is thrown upward, it starts with an initial velocity, say
, which is positive ().
Since gravity acts downwards, the acceleration of the ball throughout its flight is constant and negative:
Using the first equation of motion, we can relate velocity at any time as:
Substituting :
This is a linear equation of the form , where:
- The velocity corresponds to the y-axis ().
- The time corresponds to the x-axis ().
- The slope is , which is constant and negative.
- The y-intercept is , which is positive.
2. Graph Analysis:
- At initial time (): The velocity is at its maximum positive value, .
- During Ascent: As the ball rises, its velocity decreases linearly due to constant deceleration. The graph slopes downward.
- At the Highest Point: The velocity becomes zero (). This is the point where the straight line crosses the time axis (x-axis).
- During Descent: After reaching the peak, the ball falls back down. Its velocity becomes negative and increases in magnitude in the downward direction (i.e., becomes more and more negative) linearly with time.
3. Evaluating the Plots:
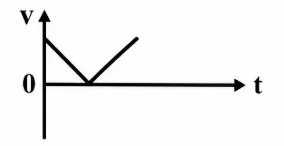
- Image 0 (Plot a): Displays a V-shaped curve where velocity decreases to zero and then increases in the positive region. This represents speed vs. time rather than velocity vs. time.
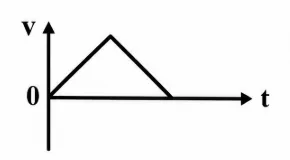
- Image 1 (Plot b): Shows velocity starting from zero, rising to a maximum, and returning to zero, which does not match uniform acceleration under gravity.
- Image 2 (Plot c): Displays a straight line with a constant negative slope starting from a positive value, passing through , and continuing into negative values. This is correct.
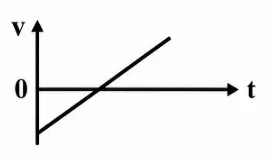
- Image 3 (Plot d): Shows a line with a positive slope starting from a negative velocity. While possible under a coordinate system where downward is positive, standard convention treats plot (c) as the primary correct velocity-time graph.
- Image 4 (Plot e): Displays a parabolic curve, which represents displacement vs. time, not velocity vs. time.
Therefore, only plot (c) is correct.
Access expert-curated educational resources and study materials—completely free.
Create, conduct, and manage professional online assessments with Mindyard. Perfect for teachers and institutes.
Copyright © 2026 Mindyard. All Rights Reserved.