
The following three items (11-13) are based on the graph given below which shows imports of three different types of steel over a period of six months of a year. Study the graph and answer the three items that follow.
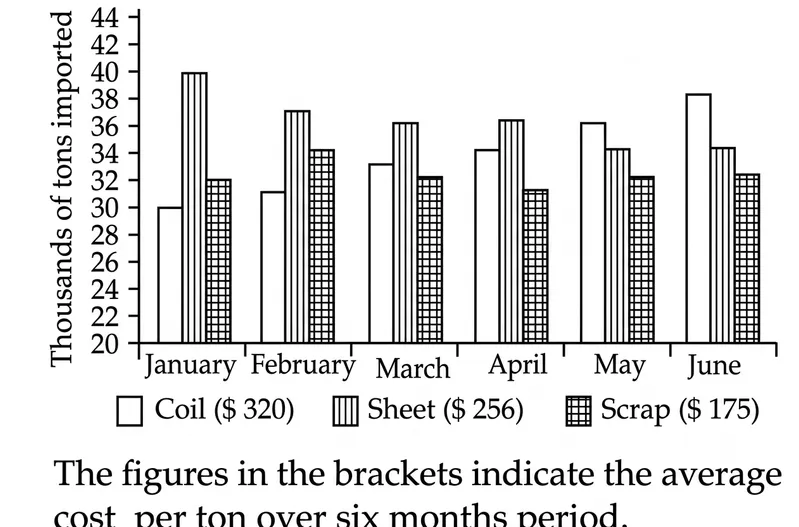
The figures in the brackets indicate the average cost per ton over six months period.
What was the approximate ratio of sheet steel and scrap steel imports in the first three months of the year?
Correct Answer :
1.2 : 1
Solution :
The correct option is 1.2 : 1.
Step-by-step Explanation:
1. Analyzing the Bar Graph:
By examining the provided graph, we observe the import levels of three types of steel (Coil, Sheet, and Scrap) measured in thousands of tons on the vertical axis (which ranges from 20 to 44 in increments of 2) across the first six months of the year (January to June).
Based on the legend:
2. Extracting the Data Points:
We read the height of the bars for the respective steel types during the first three months:
3. Calculating the Sum for Sheet Steel:
The total imports for Sheet steel in the first three months are calculated as:
So, the total is 113 thousand tons.
4. Calculating the Sum for Scrap Steel:
The total imports for Scrap steel in the first three months are calculated as:
So, the total is 98 thousand tons.
5. Finding the Ratio:
Now, we find the ratio of Sheet steel imports to Scrap steel imports:
Comparing this with the given options (1 : 1, 1.2 : 1, 1.4 : 1, 1.6 : 1), the value 1.153 is closest to 1.2.
Therefore, the approximate ratio of sheet steel to scrap steel imports in the first three months of the year is 1.2 : 1.
Access expert-curated educational resources and study materials—completely free.
Create, conduct, and manage professional online assessments with Mindyard. Perfect for teachers and institutes.
Copyright © 2026 Mindyard. All Rights Reserved.




