
The given bar graph shows the number of accidents in a city during the first 6 months of a year. Examine the bar graph and answer the question.
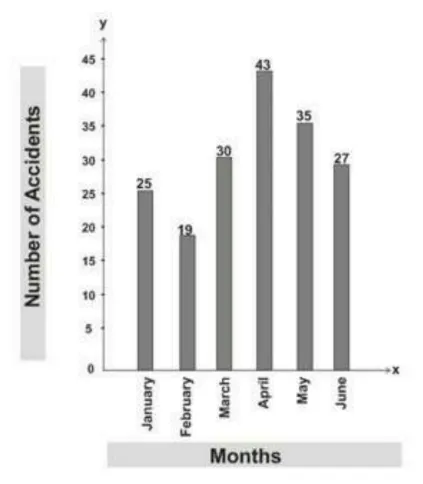
What is the percentage of accidents in the month of April with respect to the total accidents in the city during six months? (Correct to nearest integer)
Correct Answer :
24%
Solution :
The correct option is 24%.
From the given bar graph, we can observe the number of accidents in each of the six months as follows:
• January: 25
• February: 19
• March: 30
• April: 43
• May: 35
• June: 27
First, calculate the total number of accidents during the six months:
Next, find the number of accidents in the month of April, which is 43.
Now, calculate the percentage of accidents in April with respect to the total accidents:
Rounding off to the nearest integer, we get 24%.
Access expert-curated educational resources and study materials—completely free.
Create, conduct, and manage professional online assessments with Mindyard. Perfect for teachers and institutes.
Copyright © 2026 Mindyard. All Rights Reserved.




