The graph correctly representing the variation of image distance ’v’ for a convex lens of focal length ’f’ versus object distance ’u’ is_____.
Fill in the blank with the correct answer from the options given below.
Options
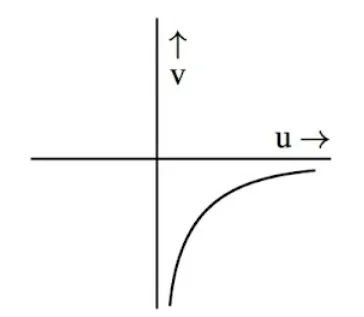
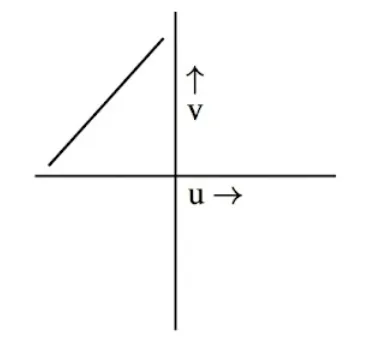
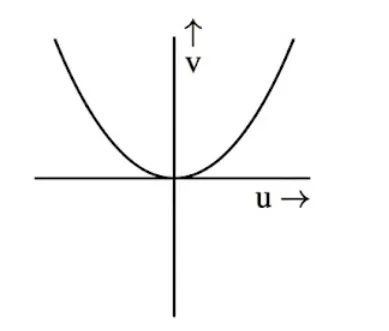
Correct Answer :
Solution :
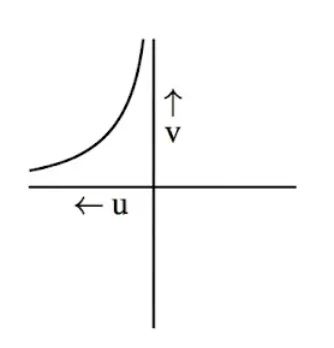
The correct graph representing the variation of image distance versus object distance for a convex lens of focal length is the graph shown in the second image (where the curve lies in the upper-left region with the horizontal axis labeled pointing to the left as and the vertical axis pointing up as ).
Step-by-Step Explanation:
According to the lens formula, we have:
where:
- is the object distance,
- is the image distance, and
- is the focal length of the convex lens.
Rearranging the formula to express in terms of and :
Taking the reciprocal, we get:
By standard sign convention:
- The focal length of a convex lens is positive ().
- For a real object, the object is placed in front of the lens, so the object distance is negative ().
Let us analyze the behavior of the image distance for different positions of the real object:
1. When the object is at infinity ():
The real image is formed at the focus on the other side of the lens ().
2. When the object is at the focus ():
The denominator becomes zero, which means:
The image is formed at infinity.
Thus, as the real object moves from infinity to the focus (i.e., varies from to ), the image distance is positive and increases from to .
This relationship forms a branch of a rectangular hyperbola in the second quadrant of the plane (where is negative and is positive).
Comparing this behavior with the given images:
- The graph in the second image shows the horizontal axis representing the negative object distance (indicated by the arrow pointing to the left: ) and the vertical axis representing the positive image distance (indicated by the arrow pointing up: ).
- The curve asymptotically approaches the vertical line corresponding to the focus and decreases towards a constant positive value as increases in magnitude.
Therefore, this graph is the correct representation.
Access expert-curated educational resources and study materials—completely free.
Create, conduct, and manage professional online assessments with Mindyard. Perfect for teachers and institutes.
Copyright © 2026 Mindyard. All Rights Reserved.