The graph which shows the variation of and its kinetic energy, E is (where λ is de Broglie wavelength of a free particle):
Options
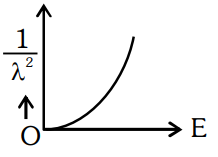 .
.
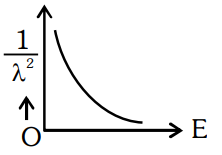 .
.
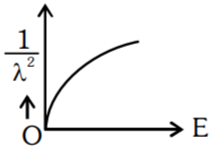 .
.
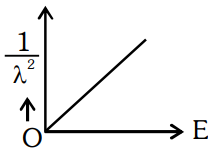 .
.
Correct Answer :
.
Solution :
The correct option is Option 4 (the graph in Image 3 representing a straight line passing through the origin).
To find the correct graph showing the variation of with kinetic energy , we can derive the mathematical relationship between these variables step-by-step:
1. The de Broglie wavelength of a free particle of momentum is given by the relation:
where is Planck's constant.
2. The kinetic energy of a particle of mass is related to its momentum by the equation:
Rearranging this equation to express momentum in terms of kinetic energy gives:
3. Substituting this expression for back into the de Broglie wavelength formula yields:
4. Squaring both sides of the equation to eliminate the square root gives:
5. Taking the reciprocal of both sides leads to the final relation:
6. Since the mass of the particle and Planck's constant are constants, the quantity is also a constant. Therefore, we can write:
This is a linear equation of the form , where , , and the slope is positive. The graph corresponding to this relation is a straight line starting from the origin and extending with a constant positive slope, as depicted in the graph of Image 3 (Option 4).
Access expert-curated educational resources and study materials—completely free.
Create, conduct, and manage professional online assessments with Mindyard. Perfect for teachers and institutes.
Copyright © 2026 Mindyard. All Rights Reserved.