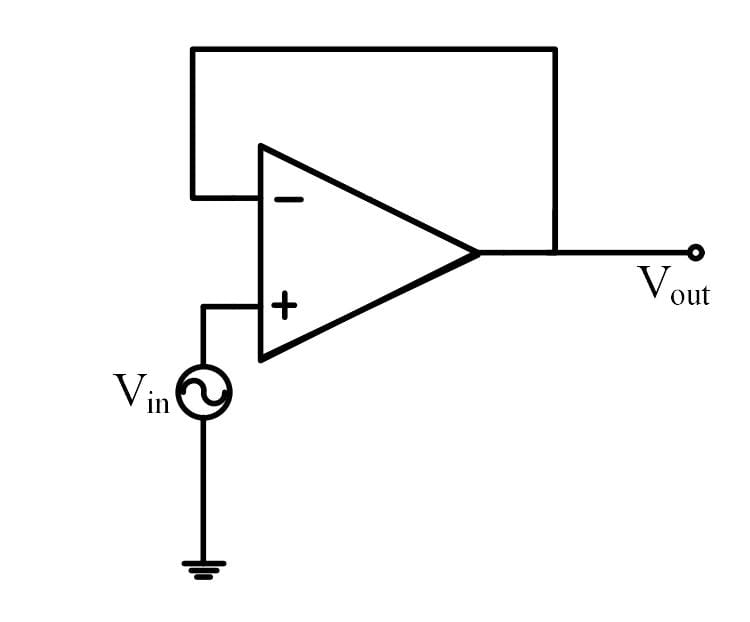
The output impedance of a non-ideal operational amplifier is denoted by Zout . The variation in the magnitude of Zout with increasing frequency, f , in the circuit shown below, is best represented by
Options
Correct Answer :
Solution :
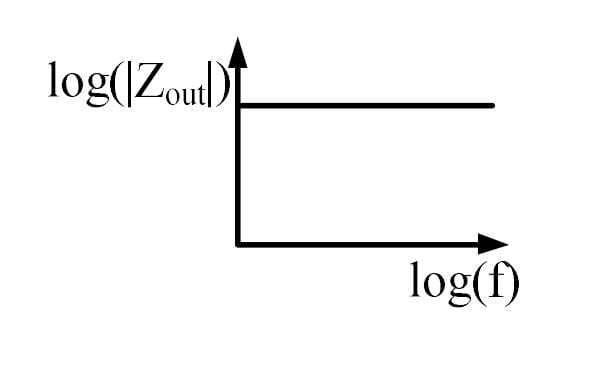
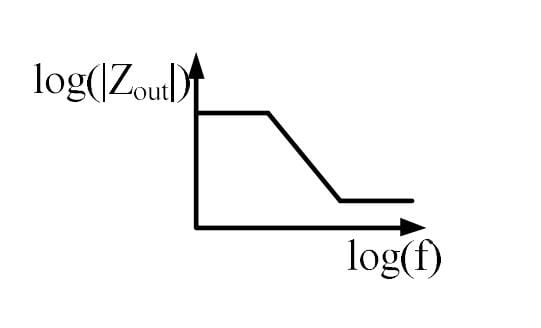
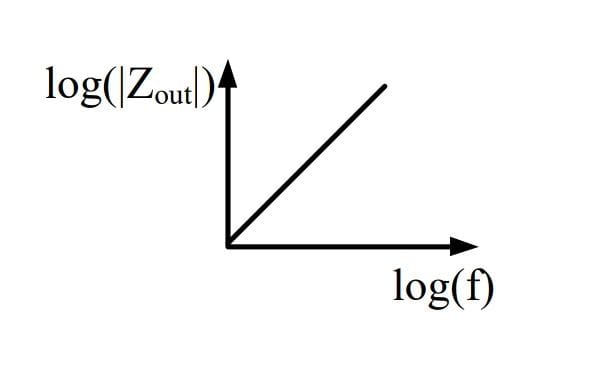
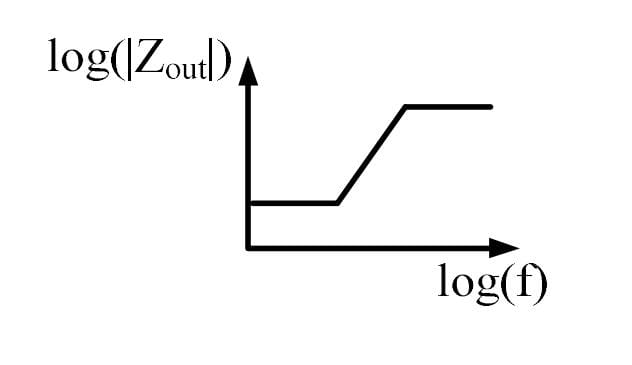
The correct representation of the closed-loop output impedance variation with frequency is given by the plot showing an initially constant low impedance value, followed by an increasing slope, and eventually saturating at higher frequencies:
1. Understanding the Circuit Configuration:
The given circuit diagram shows a non-ideal operational amplifier connected in a unity-gain voltage follower configuration with negative feedback:
For a voltage follower, the feedback factor is .
2. Closed-Loop Output Impedance Derivation:
Due to negative feedback (voltage-series feedback), the closed-loop output impedance of an op-amp is reduced by the loop gain factor:
where is the open-loop output resistance of the non-ideal op-amp and is the open-loop frequency-dependent gain of the op-amp.
3. Open-Loop Gain Frequency Response:
A typical non-ideal op-amp exhibits a dominant pole frequency response:
- At very low frequencies (), the open-loop gain is large and constant (). Thus, the closed-loop output impedance is constant and extremely low:
- At intermediate frequencies (), the open-loop gain drops by 20 dB/decade (). As the denominator decreases with frequency, increases proportionally with frequency (a positive slope of +20 dB/decade on a logarithmic plot).
- At very high frequencies (), the open-loop gain approaches zero (). The feedback loop loses control, and the output impedance approaches the internal open-loop output resistance:
4. Conclusion:
On a log-log scale of versus , the curve starts flat at a low magnitude, increases linearly with frequency, and then flattens out again at higher frequencies. Therefore, the fourth graph correctly illustrates the frequency dependence of .
Access expert-curated educational resources and study materials—completely free.
Create, conduct, and manage professional online assessments with Mindyard. Perfect for teachers and institutes.
Copyright © 2026 Mindyard. All Rights Reserved.