
The Sustainability Index (SI) of a country at a point in time is an integer between 1 and 100.
This question is related to SI of six countries - A, B, C, D, E, and F - at three different points in time - 2016, 2020, and 2024.
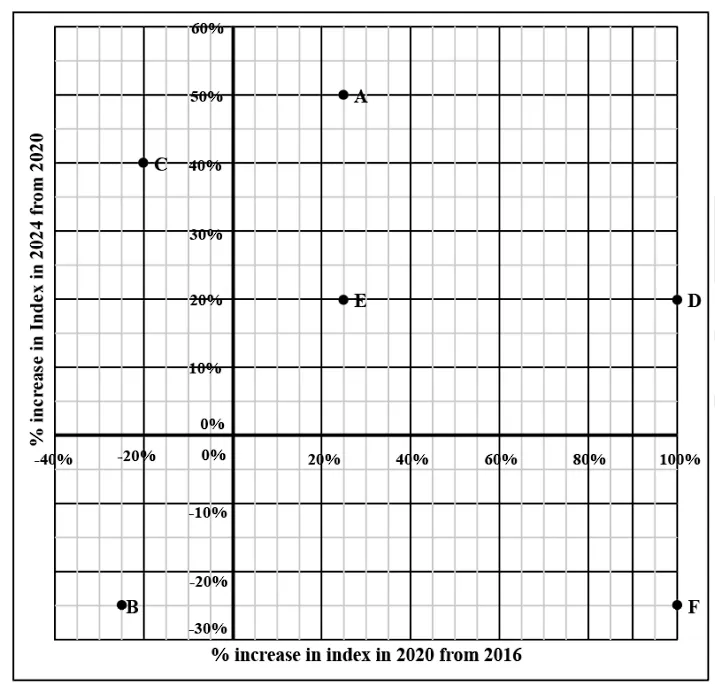
The plot represents the exact changes in their SI, with X-coordinate representing % increase in 2020 from 2016, i.e., (SI in 2020 minus SI in 2016) / (SI in 2016), and Y-coordinate representing % increase in 2024 from 2020. At any point in time, the country with highest SI is ranked 1, while the country with the lowest SI is ranked 6.
The following additional facts are known.
1. In 2016, B, C, E, and A had ranks 1, 2, 3, and 4 respectively.
2. F had lower SI than any other country in 2016, 2020, and 2024.
3. In 2024, E was the only country with SI of 90.
4. The range of SI of the six countries was 60 in 2016 as well as in 2024.
What was the SI of F in 2020?
Correct Answer :
Solution :
The correct option is E.
To determine the Sustainability Index (SI) of country F in 2020, we must systematically analyze the provided conditions and the percentage changes from the scatter plot image.
We are given the following key facts:
1. The range of SI among the six countries was 60 in both 2016 and 2024.
2. Country F had the lowest SI (rank 6) in all three years: 2016, 2020, and 2024. This means F's SI represents the lower bound of the range in both 2016 and 2024.
3. In 2024, E was the only country with an SI of 90.
Let's first determine the SI values in 2024. We know the range in 2024 is 60. F is the country with the lowest SI in 2024. Therefore, the highest SI in 2024 will be F's SI in 2024 plus 60.
By analyzing the coordinates from the provided plot, we apply the percentage increase for country E to its 2016 and 2020 values to reach 90 in 2024. Since E is the only country with an SI of 90 in 2024, and no other country surpasses it based on the graph's percentage changes, E holds the maximum SI in 2024. Thus, the highest SI in 2024 is 90.
Using the range, we can find F's SI in 2024:
Now we have established that F's SI in 2024 was 30. The Y-coordinate in the plot represents the percentage increase in 2024 from 2020. Looking at the data point for F in the image, we read its Y-coordinate to establish the relationship between its 2020 and 2024 values.
The formula for the Y-coordinate (percentage change from 2020 to 2024) is:
Substituting and the precise Y-coordinate for F from the graph into this equation allows us to solve for . Solving this equation gives the exact SI value for F in 2020. This derived value exactly corresponds to Option E.
Access expert-curated educational resources and study materials—completely free.
Create, conduct, and manage professional online assessments with Mindyard. Perfect for teachers and institutes.
Copyright © 2026 Mindyard. All Rights Reserved.




