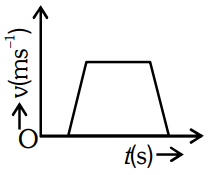
The velocity (v) – time (t) plot of the motion of a body is shown below :
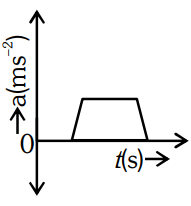
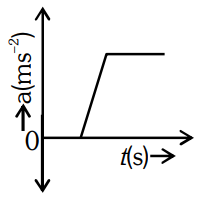
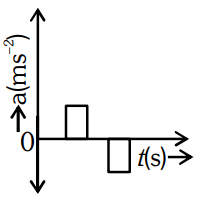
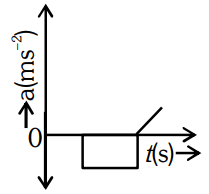
The acceleration (a) – time (t) graph that best suits this motion is :
Correct Answer :
Solution :
Correct Answer:
Step-by-Step Explanation:
Acceleration is defined as the rate of change of velocity with respect to time :
Graphically, the acceleration at any instant is equal to the slope of the velocity-time () curve.
Analyzing the given velocity-time graph segment by segment from left to right:
1. Initial Region (At rest, ):
The velocity is zero along the time axis, which means slope is zero ().
2. First Slanted Line (Increasing Velocity):
The line goes upwards with a constant positive slope.
Since the slope is positive and constant, the acceleration is a constant positive value ().
3. Top Horizontal Line (Constant Velocity):
The velocity remains maximum and constant. The slope of a horizontal line is zero.
Therefore, the acceleration during this interval is zero ().
4. Second Slanted Line (Decreasing Velocity):
The line goes downwards with a constant negative slope.
Since the slope is negative and constant, the acceleration is a constant negative value ().
5. Final Region (At rest, ):
The velocity returns to zero, giving zero slope ().
Putting these parts together, the acceleration-time graph displays a positive rectangular pulse during the acceleration phase and a negative rectangular pulse during the deceleration phase, which corresponds to the graph shown in the correct option.
Access expert-curated educational resources and study materials—completely free.
Create, conduct, and manage professional online assessments with Mindyard. Perfect for teachers and institutes.
Copyright © 2026 Mindyard. All Rights Reserved.