The velocity (v) – time (t) plot of the motion of a body is shown below:
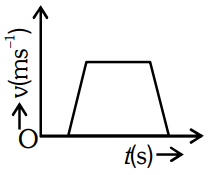
The acceleration (a) – time (t) graph that best suits this motion is :
Options
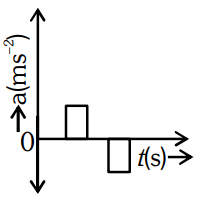
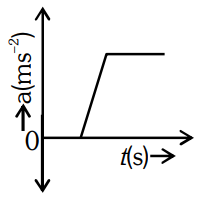
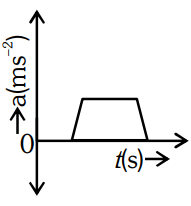
Correct Answer :
Solution :
The correct option is Option 1 (represented by the first graph).
Step-by-Step Explanation:
To determine the corresponding acceleration–time (–) graph from the given velocity–time (–) graph, we use the fundamental definition of acceleration.
Acceleration is the rate of change of velocity with respect to time. Mathematically, it is defined as the derivative of velocity:
This derivative corresponds to the slope of the tangent to the curve on a velocity–time (–) graph at any given instant.
Let us analyze the motion by breaking the velocity–time graph into five distinct consecutive time intervals:
1. First Interval (Initial horizontal line on the time axis):
The velocity is constant and remains at zero (). Since the velocity is not changing, the slope of the line is zero.
Therefore, the acceleration is:
This is represented by a horizontal segment along the time-axis in the – graph.
2. Second Interval (Upward sloping straight line):
The velocity increases linearly with time. For a straight line sloping upwards, the slope is constant and positive.
Therefore, the acceleration is constant and positive:
This is represented by a flat, positive rectangular step above the time-axis in the – graph.
3. Third Interval (Horizontal flat peak line):
The velocity remains constant at its maximum value. For a horizontal straight line, the slope is zero.
Therefore, the acceleration is:
This is represented by a horizontal segment along the time-axis in the – graph.
4. Fourth Interval (Downward sloping straight line):
The velocity decreases linearly with time. For a straight line sloping downwards, the slope is constant and negative.
Therefore, the acceleration is constant and negative:
This is represented by a flat, negative rectangular step below the time-axis in the – graph.
5. Fifth Interval (Final horizontal line on the time axis):
The velocity is constant and remains at zero. The slope of the line is zero.
Therefore, the acceleration is:
This is represented by a final horizontal segment along the time-axis in the – graph.
Conclusion:
Combining these intervals, the acceleration–time graph starts at zero, jumps to a constant positive value, returns to zero, drops to a constant negative value, and finally returns to zero. This sequence corresponds exactly to the rectangular pulses shown in Option 1.
Access expert-curated educational resources and study materials—completely free.
Create, conduct, and manage professional online assessments with Mindyard. Perfect for teachers and institutes.
Copyright © 2026 Mindyard. All Rights Reserved.