The velocity (v) – time (t) plot of the motion of a body is shown below:
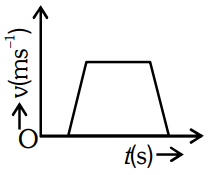
The acceleration (a) – time (t) graph that best suits this motion is :
Options
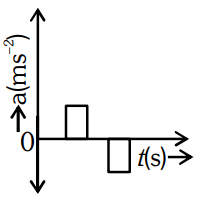 .
.
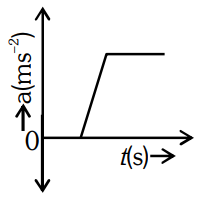 .
.
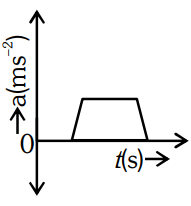 .
.
.
Correct Answer :
.
Solution :
The correct option is the first graph (Option 1), which shows a positive rectangular step of acceleration, followed by a period of zero acceleration, and then a negative rectangular step of acceleration.
To understand why this is the correct acceleration-time graph, we can analyze the given velocity-time () plot segment by segment. Recall that acceleration () is the rate of change of velocity with respect to time, which corresponds to the slope of the velocity-time graph:
Let's break down the motion into five distinct time intervals based on the velocity-time graph shown in the question:
1. Initial stationary period:
Initially, the velocity remains at zero () for a short duration. Since the velocity is constant and the slope is zero, the acceleration is:
2. Linear increase in velocity (Uniform Acceleration):
Next, the velocity increases linearly with time (represented by a straight line with a constant positive slope). Because the slope is positive and constant, the acceleration is constant and positive:
This is represented on the acceleration-time graph as a flat, positive line segment above the time axis.
3. Constant velocity period:
The velocity then reaches a maximum value and remains constant (represented by the flat horizontal top of the trapezoid). Since the velocity is not changing, the slope is zero, meaning the acceleration is:
4. Linear decrease in velocity (Uniform Retardation):
The velocity then decreases linearly back to zero (represented by a straight line with a constant negative slope). Because the slope is negative and constant, the acceleration is constant and negative:
This is represented on the acceleration-time graph as a flat, negative line segment below the time axis.
5. Final stationary period:
Finally, the velocity remains at zero again. Since the velocity is constant, the acceleration returns to:
Comparing these steps to the options, the graph in Option 1 perfectly matches this sequence: zero acceleration, a constant positive step, zero acceleration, a constant negative step, and finally zero acceleration.
Access expert-curated educational resources and study materials—completely free.
Create, conduct, and manage professional online assessments with Mindyard. Perfect for teachers and institutes.
Copyright © 2026 Mindyard. All Rights Reserved.