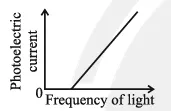
Which of the following options represent the variation of photoelectric current with property of light shown on the x-axis?
Options
 .
.
 .
.
 .
.
 .
.
Correct Answer :
.
Solution :
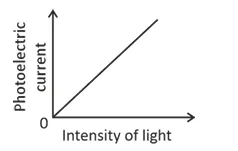
The correct option is the first graph, which represents a straight line passing through the origin with the photoelectric current plotted on the y-axis and the intensity of light plotted on the x-axis.
Explanation:
1. Relationship between Photoelectric Current and Light Intensity:
In the photoelectric effect, the intensity of light is a measure of the number of photons incident on the photosensitive surface per unit area per unit time. Assuming the frequency of the incident light is above the threshold frequency (), each incident photon can liberate a single photoelectron.
Therefore, the number of photoelectrons emitted per second (which constitutes the photoelectric current) is directly proportional to the number of photons incident per second (which is the intensity of the incident light):
This direct proportionality results in a linear graph passing through the origin (0, 0), as shown in the first image.
2. Analysis of other options:
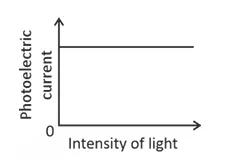
- Second Image (Current vs Intensity is constant): This graph shows that the photoelectric current remains constant as intensity increases, which is incorrect because more intense light delivers more photons, producing more photoelectrons.
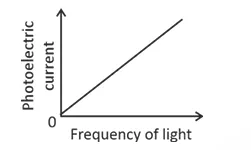
- Third and Fourth Images (Current vs Frequency): According to Einstein's photoelectric equation, the frequency of incident light determines the maximum kinetic energy () of the emitted photoelectrons, not the quantity of photoelectrons. The maximum kinetic energy (or stopping potential ) increases linearly with frequency above the threshold frequency (). However, the photoelectric current itself is independent of the frequency of incident light (provided ). Thus, a graph showing photoelectric current increasing with frequency is physically incorrect.
Access expert-curated educational resources and study materials—completely free.
Create, conduct, and manage professional online assessments with Mindyard. Perfect for teachers and institutes.
Copyright © 2026 Mindyard. All Rights Reserved.