
Which one of the following represents the correct feasible region deter mined by the following constraints of an LPP?
x +y ≥10, 2x+2y ≤25, x≥0, y≥0
Options
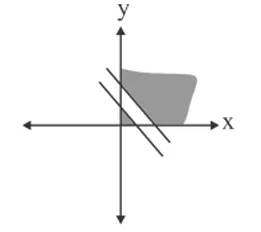
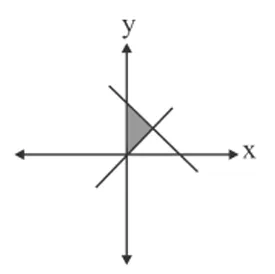
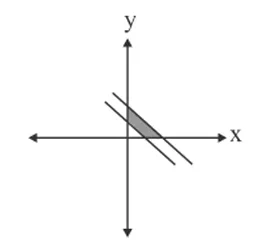
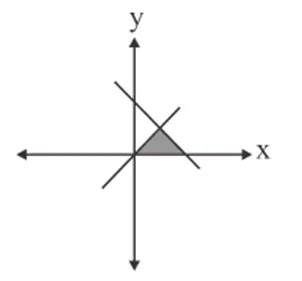
Correct Answer :
Solution :
The correct answer is the first option (represented by the first image).
To determine the correct feasible region, we examine the given inequalities of the Linear Programming Problem (LPP) one by one:
1. First constraint:
The corresponding boundary line is:
We find the intercepts of this line with the coordinate axes:
- For the y-intercept, setting gives . This corresponds to the point .
- For the x-intercept, setting gives . This corresponds to the point .
To find which half-plane represents , we substitute the coordinates of the origin into the inequality:
Since this statement is false, the feasible region lies on the side of the line that does not contain the origin (i.e., above and to the right of the line).
2. Second constraint:
The corresponding boundary line is:
which simplifies to:
We find the intercepts of this line with the coordinate axes:
- For the y-intercept, setting gives . This corresponds to the point .
- For the x-intercept, setting gives . This corresponds to the point .
To find which half-plane represents , we substitute the coordinates of the origin into the inequality:
Since this statement is true, the region lies on the side of the line that contains the origin (i.e., below and to the left of the line).
3. Non-negativity constraints: and
These constraints restrict the feasible region to the first quadrant of the coordinate plane.
Conclusion:
The feasible region is the intersection of all the shaded regions determined by the constraints. This region is a parallel band or strip in the first quadrant, bounded by:
- The y-axis from to .
- The line .
- The x-axis from to .
- The line .
Comparing the provided options:
- The first image (image_0.webp) correctly displays this parallel strip shaded in grey in the first quadrant, bounded between the lower line passing through 10 on both axes and the upper line passing through 12.5 on both axes.
- The other options show incorrect regions, such as regions that are not bounded, incorrect line intercepts, or incorrect shading directions.
Therefore, the first option is the correct graph of the feasible region.
Access expert-curated educational resources and study materials—completely free.
Create, conduct, and manage professional online assessments with Mindyard. Perfect for teachers and institutes.
Copyright © 2026 Mindyard. All Rights Reserved.




