Which plot of ln k vs 1/T is consistent with Arrhenius equation?
Options
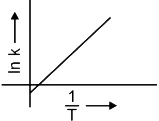 .
.
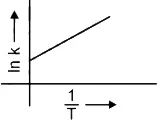 .
.
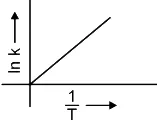 .
.
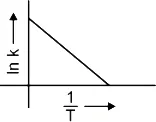 .
.
Correct Answer :
.
Solution :
According to the Arrhenius equation, the rate constant of a chemical reaction depends on the absolute temperature as follows:
where:
• is the rate constant,
• is the pre-exponential factor (Arrhenius frequency factor),
• is the activation energy of the reaction,
• is the universal gas constant, and
• is the absolute temperature in Kelvin.
Taking the natural logarithm (ln) on both sides of the Arrhenius equation:
We can compare this result with the standard equation of a straight line:
where:
• (plotted on the vertical axis),
• (plotted on the horizontal axis),
• represents the slope of the line, and
• represents the y-axis intercept.
Since the activation energy and the gas constant are both positive quantities, the slope of the line must be negative. Thus, the plot of versus is a straight line sloping downwards from left to right, with a positive vertical intercept of .
Analyzing the provided option images:
• The first graph (Image 1) shows a straight line with a positive slope and a negative y-intercept.
• The second graph (Image 2) shows a straight line with a positive slope and a positive y-intercept.
• The third graph (Image 3) shows a straight line with a positive slope passing through the origin.
• The fourth graph (Image 4) shows a straight line with a negative slope, which is consistent with the negative slope of .
Therefore, the fourth plot is the correct graph representing the Arrhenius equation.
Access expert-curated educational resources and study materials—completely free.
Create, conduct, and manage professional online assessments with Mindyard. Perfect for teachers and institutes.
Copyright © 2026 Mindyard. All Rights Reserved.