With reference to the Economic Order Quantity (EOQ) model, which one of the options given is correct?
Correct Answer :
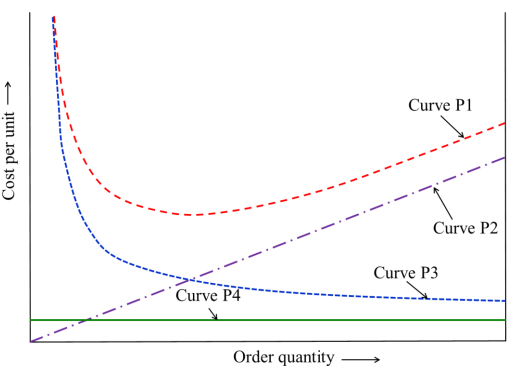
Curve P1: Total cost, Curve P2: Holding cost,
Curve P3: Setup cost, and Curve P4: Production cost.
Solution :
The correct option is:
Curve P1: Total cost, Curve P2: Holding cost, Curve P3: Setup cost, and Curve P4: Production cost.
Analysis of the Graph:
The given graph plots the Cost per unit (on the y-axis) against the Order quantity (on the x-axis) for the Economic Order Quantity (EOQ) model. The graph contains four distinct curves labeled as Curve P1, Curve P2, Curve P3, and Curve P4. By analyzing their mathematical behavior, we can identify each cost component.
1. Curve P4 (Production Cost / Purchase Cost):
The production or unit purchase cost is constant per unit and does not depend on the order quantity (assuming no quantity discounts). Therefore, it is represented as a horizontal straight line parallel to the x-axis.
Hence, Curve P4 corresponds to the Production cost.
2. Curve P2 (Holding Cost):
The annual holding (carrying) cost is directly proportional to the average inventory level, which is half of the order quantity (Q/2). Mathematically, holding cost is given by:
where is the order quantity and is the holding cost per unit per unit time. Because it is a linear function of starting at the origin, its graph is a straight line with a positive slope.
Hence, Curve P2 corresponds to the Holding cost.
3. Curve P3 (Setup / Ordering Cost):
The annual setup (or ordering) cost is inversely proportional to the order quantity. It is calculated as:
where is the annual demand and is the cost per setup/order. As increases, the ordering cost decreases, forming a rectangular hyperbola that asymptotically approaches zero.
Hence, Curve P3 corresponds to the Setup cost.
4. Curve P1 (Total Cost):
The total cost is the sum of the setup cost, holding cost, and production cost:
At small order quantities, the setup cost dominates, making the total cost high. At large order quantities, the holding cost dominates, causing the total cost to rise again. The resulting curve is U-shaped, and its minimum point represents the Economic Order Quantity (EOQ), where the holding cost and setup cost curves intersect.
Hence, Curve P1 corresponds to the Total cost.
Access expert-curated educational resources and study materials—completely free.
Create, conduct, and manage professional online assessments with Mindyard. Perfect for teachers and institutes.
Copyright © 2026 Mindyard. All Rights Reserved.