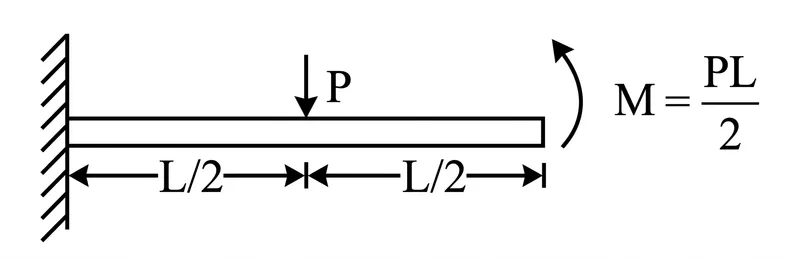
A cantilever beam is shown in figure. Neglecting mass of beam, which one of the following options is correct representation of shear force diagram and bending moment diagram?
Options
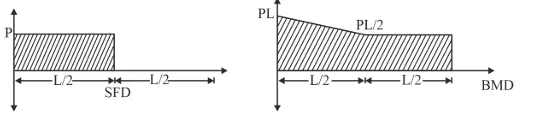
Correct Answer :
Solution :
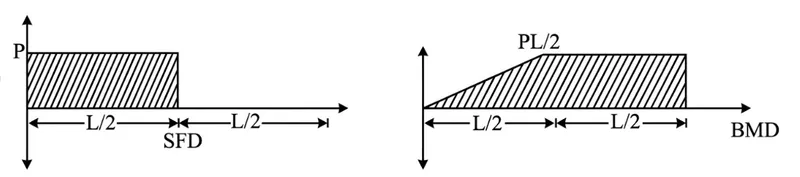
The correct option is the first option, which represents:
- A Shear Force Diagram (SFD) with a constant value of from the fixed support to the midpoint ( to ), and from the midpoint to the free end ( to ).
- A Bending Moment Diagram (BMD) that starts at at the fixed support, increases linearly to at the midpoint, and remains constant at from the midpoint to the free end.
Step-by-Step Explanation:
1. Determination of Support Reactions:
Let the fixed support at the left end be point (), the point load be at the midpoint (), and the free end with the concentrated counter-clockwise moment be point ().
Let be the vertical reaction force acting upwards at the fixed support , and be the reaction moment (assumed clockwise) at .
From vertical equilibrium of the beam:
From moment equilibrium about point (taking counter-clockwise moments as positive):
Substitute the value of the applied moment at the free end, :
Thus, the reaction moment at the fixed support is exactly zero.
2. Shear Force (SF) and Bending Moment (BM) Functions:
For Region 1: (between support and point load ):
- The only vertical force acting to the left of the section is the reaction force upwards. Therefore, the shear force is:
- The bending moment at any point is:
At , .
At , .
For Region 2: (between point load and free end ):
- The vertical forces to the left of the section are upwards and the point load downwards. Therefore, the shear force is:
- The bending moment at any point is:
This shows that the bending moment remains constant at throughout this region.
Conclusion:
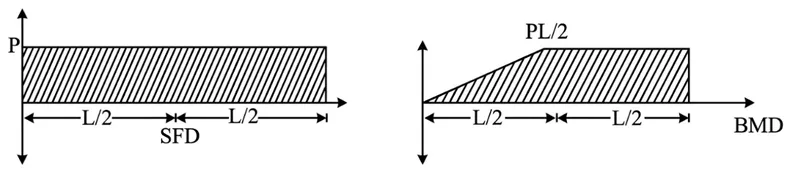
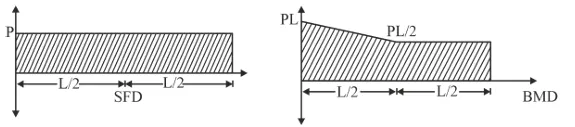
Comparing these equations to the options, we find that the diagram showing a constant shear force of in the left half and in the right half, along with a bending moment that increases linearly from to and then remains constant, is the correct representation.
Access expert-curated educational resources and study materials—completely free.
Create, conduct, and manage professional online assessments with Mindyard. Perfect for teachers and institutes.
Copyright © 2026 Mindyard. All Rights Reserved.