A project consists of five activities (A, B, C, D and E). The duration of each activity follows beta distribution. The three time estimates (in weeks) of each activity and immediate predecessor(s) are listed in the table. The expected time of the project completion is __________ weeks (in integer).
Activity Time estimates (in weeks) Immediate predecessor(s) Optimistic time Most likely time Pessimistic time A 4 5 6 None B 1 3 5 A C 1 2 3 A D 2 4 6 C E 3 4 5 B, D
| Activity | Time estimates (in weeks) |
Immediate predecessor(s) |
||
| Optimistic time |
Most likely time |
Pessimistic time |
||
| A | 4 | 5 | 6 | None |
| B | 1 | 3 | 5 | A |
| C | 1 | 2 | 3 | A |
| D | 2 | 4 | 6 | C |
| E | 3 | 4 | 5 | B,D |
Correct Answer :
Correct answer is : 15
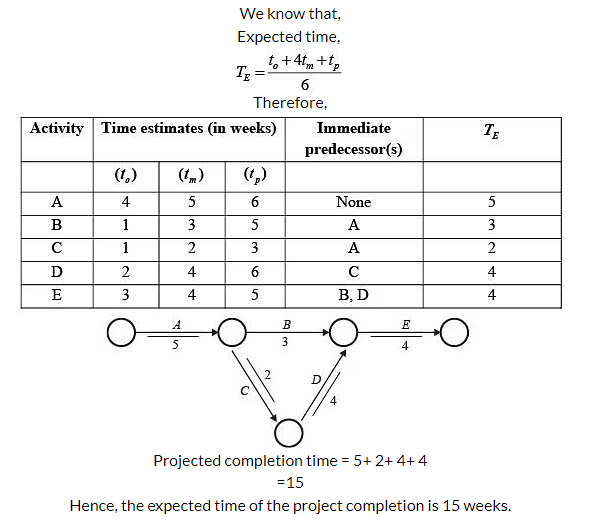
Solution :
The correct answer is 15.
Step 1: Understand the Expected Activity Duration Formula
In project scheduling using PERT (Program Evaluation and Review Technique), the activity durations follow a beta distribution. The expected time () for each activity is calculated using its three-time estimates: optimistic time (), most likely time (), and pessimistic time () by the formula:
Step 2: Calculate the Expected Time () for Each Activity
Using the table data provided in the question and shown in the image, we compute the expected times for activities A, B, C, D, and E:
Step 3: Analyze the Network Paths and Project Completion Time
By tracing the predecessors in the network diagram from the image, we can identify all possible paths from the start of the project to its completion:
Access expert-curated educational resources and study materials—completely free.
Create, conduct, and manage professional online assessments with Mindyard. Perfect for teachers and institutes.
Copyright © 2026 Mindyard. All Rights Reserved.