
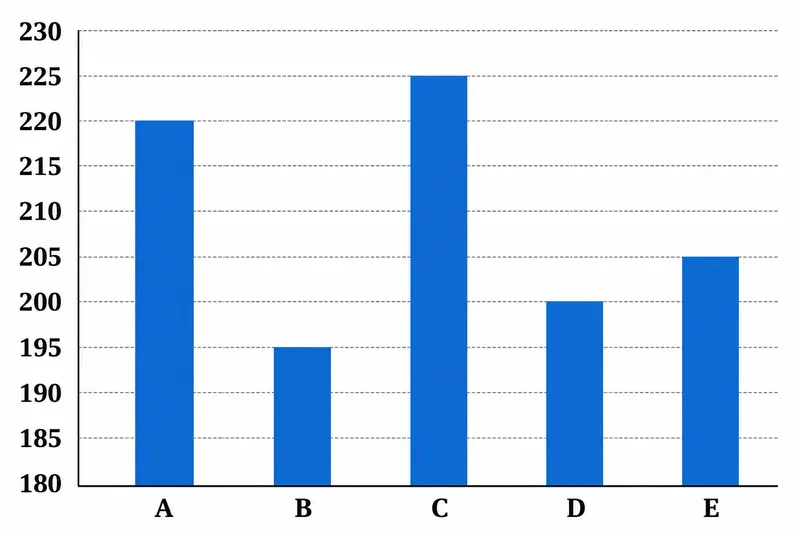
Bar graph given below shows the total number of graduate and post graduate employees in five different companies. Table shows the difference between graduate and posts graduate employees.
| Companies | Graduate – Post Graduate employees |
|---|---|
| A | 4 |
| B | 2 |
| C | 36 |
| D | 90 |
| E | 96 |
Note – Total Employees = Graduate + Post Graduate Employees
Graduate employees are more than Post Graduate Employees
Find the difference between average number of graduate employees in B and D and average number of post graduate employees in A and E?
Correct Answer :
41
Solution :
Based on the provided bar graph, we can determine the total number of employees for each company by identifying the heights of the bars:
Total employees in Company A = 220
Total employees in Company B = 196
Total employees in Company C = 224
Total employees in Company D = 200
Total employees in Company E = 204
We are given that:
Total Employees = Graduate (G) + Post Graduate (PG)
Graduate Employees > Post Graduate Employees, with the differences given in the table.
Therefore, for any company:
From these equations, we can calculate the number of Graduate (G) and Post Graduate (PG) employees for each company using:
Let's find the required values:
1. Graduate employees in B:
Total for B = 196, Difference = 2
2. Graduate employees in D:
Total for D = 200, Difference = 90
3. Post Graduate employees in A:
Total for A = 220, Difference = 4
4. Post Graduate employees in E:
Total for E = 204, Difference = 96
Now, calculate the averages:
Average number of graduate employees in B and D:
Average number of post graduate employees in A and E:
Finally, find the difference between the two averages:
Therefore, the correct option is 41.
Access expert-curated educational resources and study materials—completely free.
Create, conduct, and manage professional online assessments with Mindyard. Perfect for teachers and institutes.
Copyright © 2026 Mindyard. All Rights Reserved.




