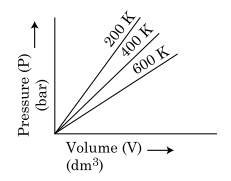
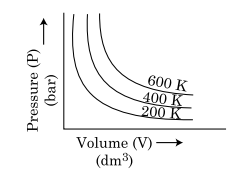
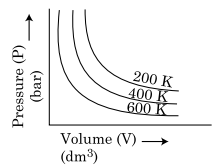
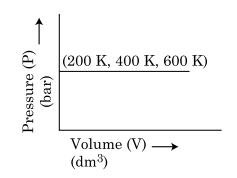
Choose the correct option for graphical representation of Boyle’s law, which shows a graph of pressure vs. volume of a gas at different temperatures :
Options
Correct Answer :
Solution :
Boyle’s law states that, for a fixed amount of gas at a constant temperature, the pressure of the gas is inversely proportional to its volume :
where is a constant for a given temperature.
When the temperature is changed while keeping the amount of gas the same, the constant also changes. A higher temperature gives a larger , which means for any particular volume the pressure will be higher.
Therefore, on a pressure‑versus‑volume graph that includes several isotherms (different temperatures), the correct graphical representation must satisfy two conditions:
The image selected as the correct answer (the second option) shows exactly these features:
By contrast, the other three images either display straight‑line relationships, intersecting curves that do not preserve the ordering by temperature, or axes that are mislabeled. Those characteristics violate Boyle’s law and therefore cannot be the correct representation.
Consequently, the graph of pressure versus volume that correctly illustrates Boyle’s law at different temperatures is the second image shown in the options.
Access expert-curated educational resources and study materials—completely free.
Create, conduct, and manage professional online assessments with Mindyard. Perfect for teachers and institutes.
Copyright © 2026 Mindyard. All Rights Reserved.