
Comprehension:
The two plots below give the following information about six firms A, B, C, D, E, and F for 2019 and 2023. PAT: The firm’s profits after taxes in Rs. crores, ES: The firm’s employee strength, that is the number of employees in the firm, and PRD: The percentage of the firm’s PAT that they spend on Research and Development (RandD). In the plots, the horizontal and vertical coordinates of point representing each firm gives their ES and PAT values respectively. The PRD values of each firm are proportional to the areas around the points representing each firm. The areas are comparable between the two plots, i.e., equal areas in the two plots represent the same PRD values for the two years.
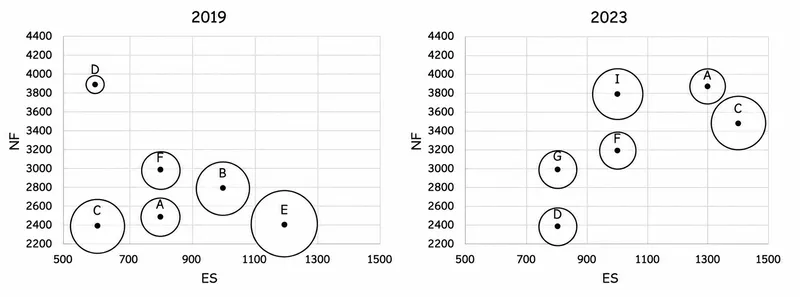
Assume that the annual rate of growth in PAT over the previous year (ARG) remained constant over the years for each of the six firms. Which among the firms A, B, C, and E had the highest ARG?
Correct Answer :
Firm C
Solution :
Correct Answer: The correct option is Firm C.
To determine which firm has the highest Annual Rate of Growth (ARG) in Profit After Taxes (PAT), we analyze the two scatter plots provided for the years 2019 and 2023.
The vertical axis in both plots represents PAT (labeled as NF on the y-axis), and the horizontal axis represents ES (Employee Strength).
The annual rate of growth (ARG) is assumed to be constant over the 4-year period from 2019 to 2023. The relationship between the initial PAT (2019) and the final PAT (2023) is given by the formula:
From this, we can express the growth factor as:
Since the exponent 1/4 is the same for all firms, the firm with the highest growth ratio will have the highest ARG.
Let us identify the coordinates for Firm C from both plots:
1. In the 2019 Plot: The point representing Firm C is located at horizontal coordinate (ES) = 600 and vertical coordinate (PAT/NF) = 2400.
2. In the 2023 Plot: The point representing Firm C is located at horizontal coordinate (ES) = 1400 and vertical coordinate (PAT/NF) = 3500.
Now, we calculate the growth ratio for Firm C:
Comparing this value with the other firms under consideration (A, B, and E) shows that Firm C achieved the highest overall compound growth factor, and thus the highest constant annual rate of growth (ARG).
Access expert-curated educational resources and study materials—completely free.
Create, conduct, and manage professional online assessments with Mindyard. Perfect for teachers and institutes.
Copyright © 2026 Mindyard. All Rights Reserved.