
Consider the following graph in which the birth rate and death rate of a country are given, and answer the two items (63-64) that follow.
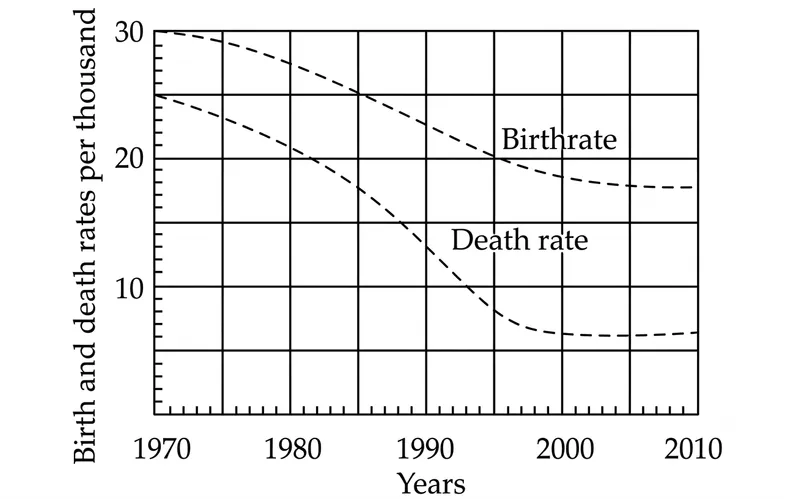
With reference to the above graph, consider the following statements considering 1970 as base year:
1. Population has stabilized after 35 years.
2. Population growth rate has stabilized after 35 years.
3. Death rate has fallen by 10% in the first 10 years.
4. Birth rate has stabilized after 35 years.
Which of the above are the most logical and rational statements that can be made from the above graph?
Correct Answer :
2 and 4
Solution :
The correct option is 2 and 4.
Analysis of the Graph:
The horizontal axis (x-axis) represents the years from 1970 to 2010, where 1970 is the base year. The vertical axis (y-axis) represents the birth and death rates per thousand. Any period of "35 years after the base year" corresponds to the year:
Let us evaluate each of the statements systematically:
1. Evaluation of Statement 1 (Population has stabilized after 35 years):
For a population to stabilize, the birth rate must equal the death rate so that net natural growth is zero. In the year 2005, the birth rate is approximately 18 per thousand and the death rate is approximately 6 per thousand. Since the birth rate is significantly higher than the death rate, the population continues to grow. Therefore, Statement 1 is incorrect.
2. Evaluation of Statement 2 (Population growth rate has stabilized after 35 years):
The population growth rate is the difference between the birth rate and the death rate. Looking at the curves after 2005 (between 2005 and 2010), both the birth rate curve (flat at ~18 per thousand) and the death rate curve (flat at ~6 per thousand) become parallel to the x-axis. Because both rates have constant values, their difference:
per thousand remains constant (stabilized). Therefore, Statement 2 is correct.
3. Evaluation of Statement 3 (Death rate has fallen by 10% in the first 10 years):
The first 10 years corresponds to the interval from 1970 to 1980.
- Death rate in 1970 = 25 per thousand (the starting point of the death rate curve on the y-axis).
- Death rate in 1980 = 22 per thousand.
The percentage decline in the death rate is calculated as:
Since the actual fall is 12% rather than 10%, Statement 3 is incorrect.
4. Evaluation of Statement 4 (Birth rate has stabilized after 35 years):
In 2005 (35 years after 1970), the birth rate is approximately 18 per thousand. From 2005 onwards to 2010, the curve becomes horizontal and flat, indicating that the birth rate has stabilized. Therefore, Statement 4 is correct.
Conclusion:
Since statements 2 and 4 are the only correct and logical statements, the correct option is 2 and 4.
Access expert-curated educational resources and study materials—completely free.
Create, conduct, and manage professional online assessments with Mindyard. Perfect for teachers and institutes.
Copyright © 2026 Mindyard. All Rights Reserved.




