
Consider the following graphs. The curves in the graphs indicate different age groups in the populations of two countries A and B over a period of few decades:
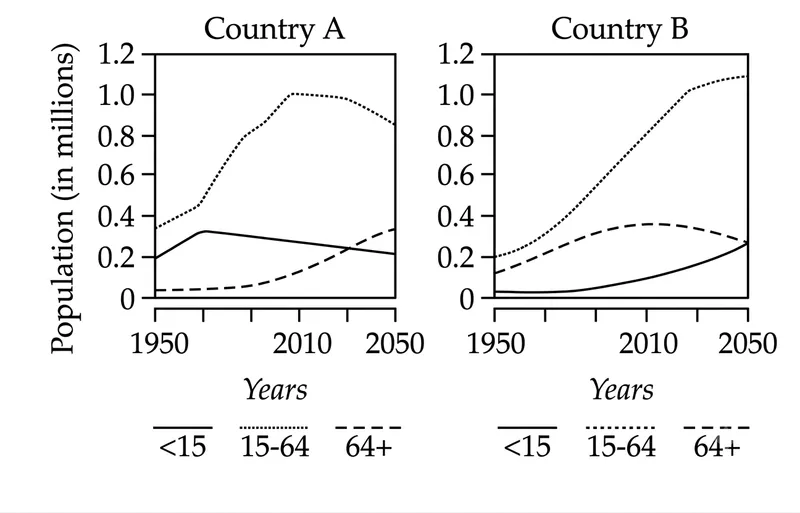
With reference to the above graphs, which of the following are the most logical and rational inferences that can be made?
1. Over the last two and a half decades, the dependency ratio for country B has decreased.
2. By the end of next two and a half decades, the dependency ratio of country A will be much less than that of country B.
3. In the next two decades, the workforce relative to its total population will increase in country B as compared to country A.
Select the correct answer using the code given below.
Correct Answer :
1 and 3 only
Solution :
The correct answer/option is 1 and 3 only.
To analyze the given graphs, we first define the key demographic terms represented by the three age group curves:
1. Young Population (under 15 years): Indicated by the solid line.
2. Working-age Population/Workforce (15 to 64 years): Indicated by the dotted line.
3. Elderly Population (64 years and above): Indicated by the dashed line.
The Dependency Ratio is defined as the ratio of the dependent population (those under 15 and over 64) to the working-age population (15-64):
Let us evaluate each of the three statements step-by-step:
Evaluating Statement 1: "Over the last two and a half decades, the dependency ratio for country B has decreased."
Assuming the current period is around 2020-2025, the last two and a half decades correspond approximately to the period from 2000 to 2025.
Looking at the graph for Country B:
- Around the year 2000, the working-age population (dotted line) is about 0.7 million, the young population (solid line) is about 0.05 million, and the elderly population (dashed line) is about 0.35 million.
The dependency ratio is approximately:
- By the year 2025, the working-age population (dotted line) rises significantly to about 1.05 million, the young population (solid line) rises to about 0.18 million, and the elderly population (dashed line) decreases to about 0.32 million.
The dependency ratio is approximately:
Since the ratio decreased from 0.57 to 0.48, Statement 1 is correct.
Evaluating Statement 2: "By the end of next two and a half decades, the dependency ratio of country A will be much less than that of country B."
The end of the next two and a half decades corresponds to the year 2050.
- In Country A (by 2050):
The working-age population (dotted line) is about 0.85 million, the young population (solid line) is about 0.21 million, and the elderly population (dashed line) is about 0.33 million.
The dependency ratio for Country A is:
- In Country B (by 2050):
The working-age population (dotted line) is about 1.1 million, the young population (solid line) is about 0.26 million, and the elderly population (dashed line) is about 0.27 million.
The dependency ratio for Country B is:
Since 0.64 is greater than 0.48, the dependency ratio of Country A will be higher than that of Country B. Therefore, Statement 2 is incorrect.
Evaluating Statement 3: "In the next two decades, the workforce relative to its total population will increase in country B as compared to country A."
The workforce relative to the total population is defined as:
- In Country A, the workforce (dotted line) peaked around 2010 (~1.0 million) and shows a continuous decline towards 2050 (~0.85 million), while the dependent elderly population (dashed line) is rising rapidly. Consequently, the proportion of the workforce relative to the total population is decreasing in Country A.
- In Country B, the workforce (dotted line) continues to rise significantly towards its peak at 2050 (~1.1 million), while the elderly population (dashed line) decreases from its peak near 2010-2015. Thus, the workforce relative to the total population increases in Country B.
Hence, Statement 3 is correct.
Therefore, statements 1 and 3 are correct, and statement 2 is incorrect.
Access expert-curated educational resources and study materials—completely free.
Create, conduct, and manage professional online assessments with Mindyard. Perfect for teachers and institutes.
Copyright © 2026 Mindyard. All Rights Reserved.