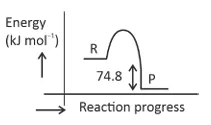
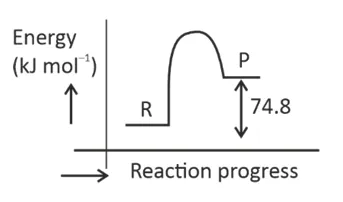
C(s) + 2H2(g) → CH4(g); ∆H = –74.8 kJ mol–1. Which of the following diagrams gives an accurate representation of the above reaction? [R → reactants; P → products]
Options
 .
.
 .
.
 .
.
 .
.
Correct Answer :
.
Solution :
The correct answer is the diagram where the reactants (R) are at a higher energy level than the products (P), and the vertical energy difference between their levels is labeled 74.8 kJ mol⁻¹ (as shown in the first image, image_0.webp).
To determine the correct energy profile diagram, we analyze the thermodynamic properties of the given chemical reaction:
The change in enthalpy () for this reaction is given as:
1. Determine if the reaction is exothermic or endothermic:
A negative enthalpy change () indicates that the reaction is exothermic, meaning energy is released to the surroundings. For an endothermic reaction, would be positive.
2. Analyze the energy levels of reactants and products:
The enthalpy change is defined as the difference between the total enthalpy of the products () and the reactants ():
Since , we have:
This means that the reactants (R) must be at a higher potential energy level than the products (P) on the energy diagram.
3. Identify the enthalpy difference in the diagram:
The magnitude of the energy difference between the reactants and products is . In the correct diagram (image_0.webp):
• The vertical axis is labeled "Energy (kJ mol⁻¹)" and the horizontal axis is labeled "Reaction progress".
• The horizontal line representing the reactants (R) is higher than the horizontal line representing the products (P).
• A vertical double-headed arrow directly spanning the difference between the energy level of R and the energy level of P is labeled with the value "74.8".
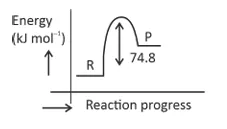
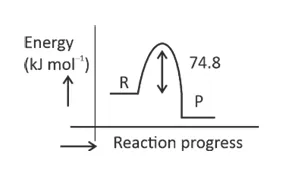
Other options show incorrect relationships, such as representing an endothermic profile (where P is higher than R), or incorrectly labeling the activation energy (the peak of the curve relative to R) as the enthalpy change.
Access expert-curated educational resources and study materials—completely free.
Create, conduct, and manage professional online assessments with Mindyard. Perfect for teachers and institutes.
Copyright © 2026 Mindyard. All Rights Reserved.