
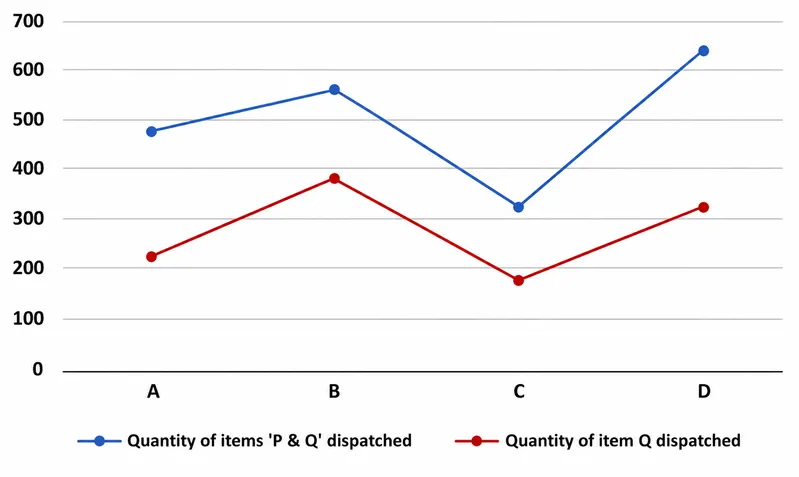
Directions (31-35):The Line graph shows total number of quantities of items (P + Q) dispatched and number of quantities of item ‘Q’ dispatched out of total items of P & Q dispatched from four (A, B C & D) different warehouses in the month of march. Read the following line chart carefully and answer the questions given below.
Find the total number of item Q dispatched from B is how much percent (approx.) more/less than total number of item P dispatched from C.
Correct Answer :
171%
Solution :
The correct answer is 171%.
Step-by-step Explanation:
From the given line graph, we can observe the values for each warehouse:
• Blue line: Total quantity of items (P + Q) dispatched.
• Red line: Quantity of item 'Q' dispatched.
Data extraction from the graph:
1. For Warehouse B:
• Total items (P + Q) dispatched = 560
• Quantity of item Q dispatched = 380
2. For Warehouse C:
• Total items (P + Q) dispatched = 325
• Quantity of item Q dispatched = 175
• Quantity of item P dispatched from C = Total (P + Q) - Q
Calculating the required percentage difference:
We need to find how much percent (approx.) the total number of item Q dispatched from B (380) is more than the total number of item P dispatched from C (140).
Rounding to the nearest whole percentage gives 171%.
Access expert-curated educational resources and study materials—completely free.
Create, conduct, and manage professional online assessments with Mindyard. Perfect for teachers and institutes.
Copyright © 2026 Mindyard. All Rights Reserved.




