
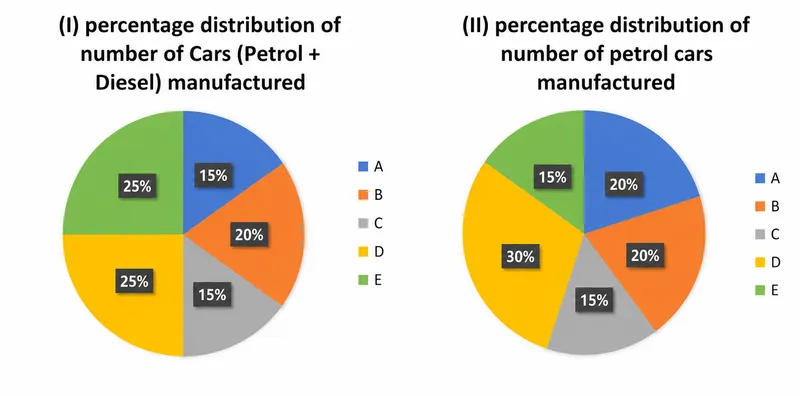
The pie chart (i) shows the distribution (in percentage/numbers) of number of Cars (Petrol + Diesel) manufactured by six companies in 2019 and pie chart (ii) shows the distribution (in percentage/numbers) of number of petrol cars manufactured by same companies in 2019. Read the both pie charts given below carefully and answer the following questions.
Find the total number of Diesel cars manufactured by company B and D together.
Correct Answer :
390
390
Solution :
Given:
Step 1: Find the total number of cars manufactured
In Pie Chart (i),
Percentage of Company E = 100% − (15% + 20% + 10% + 25% + 17.5%) = 12.5%
12.5% = 300 cars
Total cars = (300 × 100) ÷ 12.5 = 2400
Step 2: Find the total number of petrol cars manufactured
In Pie Chart (ii),
Percentage of Company E = 100% − (20% + 16% + 12% + 30% + 8%) = 14%
14% = 210 petrol cars
Total petrol cars = (210 × 100) ÷ 14 = 1500
Step 3: Find diesel cars of Companies B and D
Company B:
Total cars = 20% of 2400 = 480
Petrol cars = 16% of 1500 = 240
Diesel cars = 480 − 240 = 240
Company D:
Total cars = 25% of 2400 = 600
Petrol cars = 30% of 1500 = 450
Diesel cars = 600 − 450 = 150
Step 4: Find the required total
Total diesel cars manufactured by Companies B and D = 240 + 150 = 390
Answer: 390
Access expert-curated educational resources and study materials—completely free.
Create, conduct, and manage professional online assessments with Mindyard. Perfect for teachers and institutes.
Copyright © 2026 Mindyard. All Rights Reserved.