
Directions : The pie chart (i) shows the distribution (in percentage/numbers) of number of Cars (Petrol + Diesel) manufactured by six companies in 2019 and pie chart (ii) shows the distribution (in percentage/numbers) of number of petrol cars manufactured by same companies in 2019. Read the both pie charts given below carefully and answer the following questions.
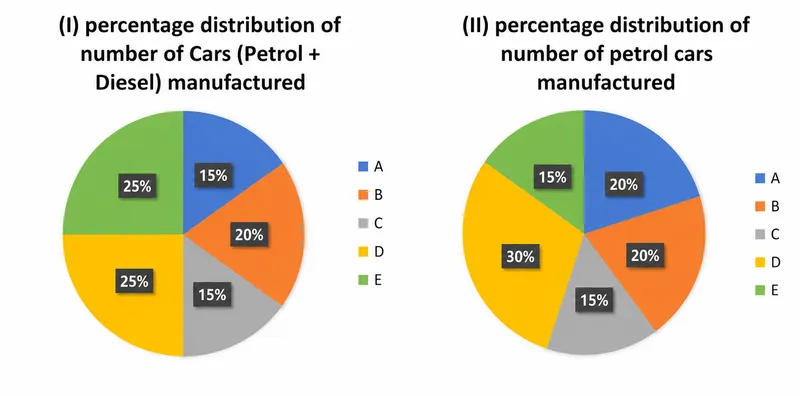
Pie Chart (i): Percentage distribution of number of Cars (Petrol + Diesel) manufactured
Pie Chart (ii): Percentage distribution of number of petrol cars manufactured
Two-fifth cars of company D remains unsold. If 65% of them are of Petrol cars, then find the sold diesel cars of company D.
Correct Answer :
66
66
Solution :
Given:
Step 1: Find the total cars, petrol cars and diesel cars of Company D
Total cars of Company D = 25% of 2400 = 600
Petrol cars of Company D = 30% of 1500 = 450
Diesel cars of Company D = 600 − 450 = 150
Step 2: Find the number of unsold cars
Unsold cars = (2/5) × 600 = 240
Unsold petrol cars = 65% of 240 = 156
Unsold diesel cars = 240 − 156 = 84
Step 3: Find the sold diesel cars
Sold diesel cars = Total diesel cars − Unsold diesel cars
= 150 − 84 = 66
Answer: 66
Access expert-curated educational resources and study materials—completely free.
Create, conduct, and manage professional online assessments with Mindyard. Perfect for teachers and institutes.
Copyright © 2026 Mindyard. All Rights Reserved.